In this tutorial, you will learn how to use different filter types available in Ultimate Forms: Filters.
Each filter type is designed for a specific kind of data and allows users to refine information in different ways — from simple text search to selecting values from lists or defining numeric and date ranges.
You will extend the Sales Dashboard created in the previous tutorial and explore how different filters behave when applied to real data.
Instructions
Before You Start
Make sure you already have:
- the Sales Tracking list with data
- the Sales Dashboard page with charts
- a Filters profile created
The list should include the following columns:
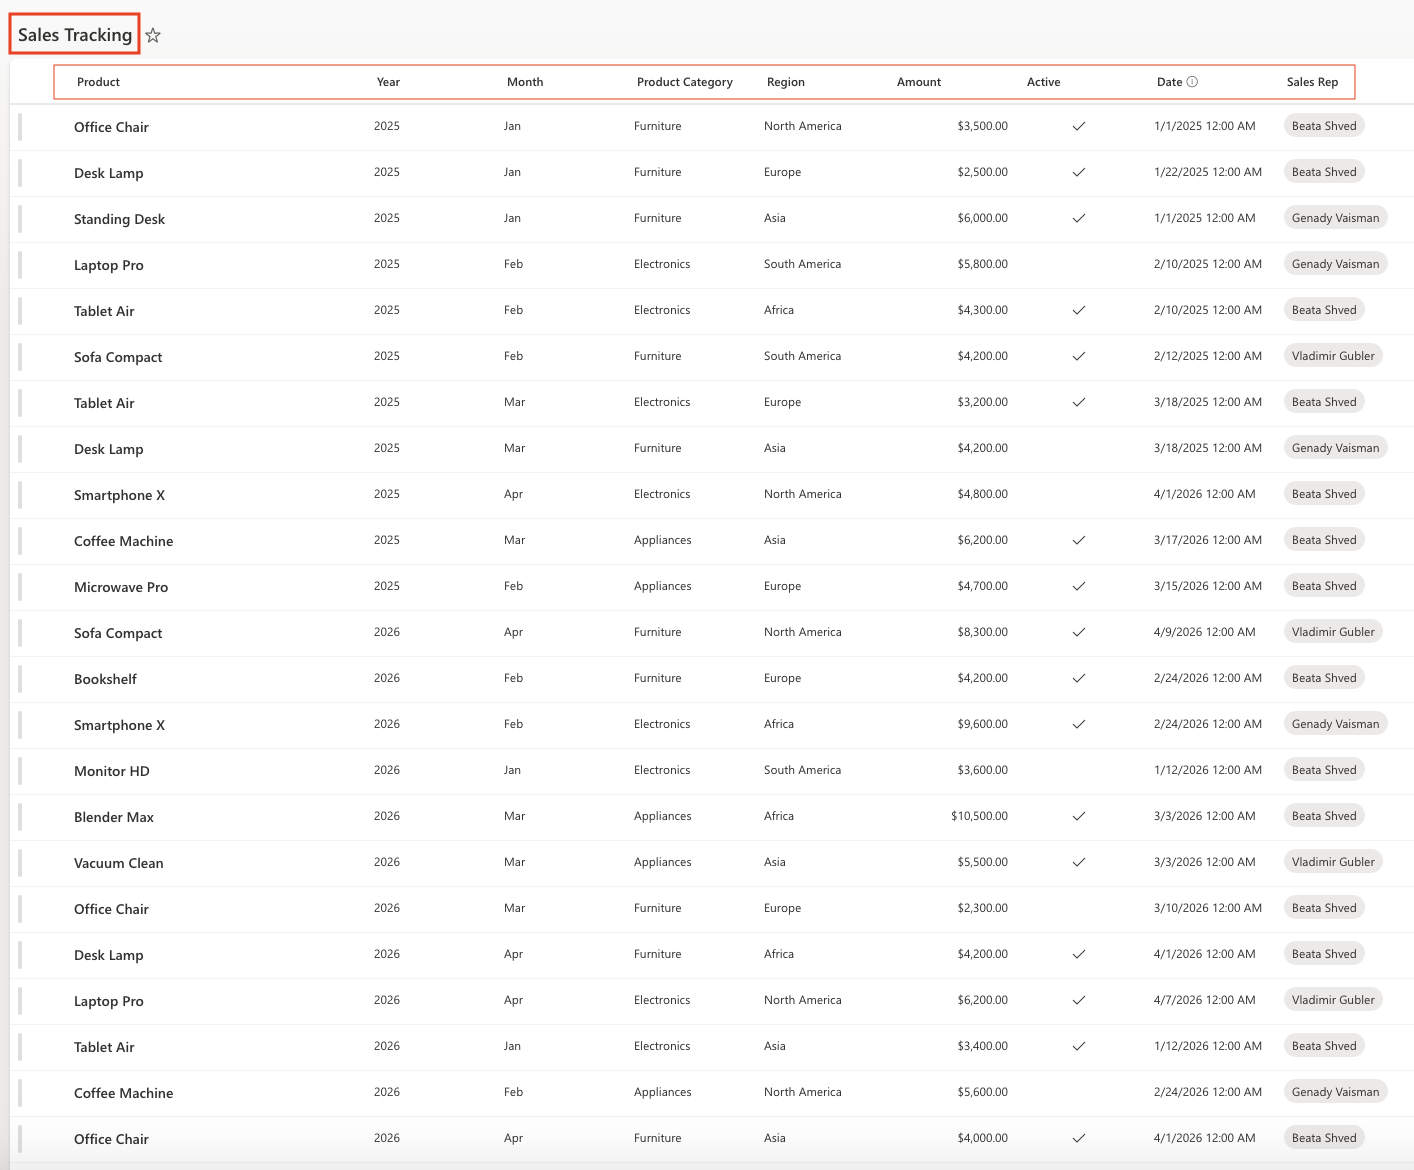
Step 1: Update the existing Filters profile
- Go to Ultimate Forms → Filters
- Open the profile Sales Filters
- Go to the Filters tab

- Disable unnecessary filters
To improve the readability of the charts, disable some of the previously created filters.
For the following filters, uncheck the Active option:
- Month
- Year
- Region
- Product Category

These filters will remain in the profile but will not be displayed on the page.
This allows you to simplify the filter panel while keeping the configuration available for future use.
Step 2: Add a Text filter
Use a Text filter to search for values.
- Filter type: Text
- Name: Product
- Column to filter: Same name as filter
- Show label: Enabled
- Active: Enabled
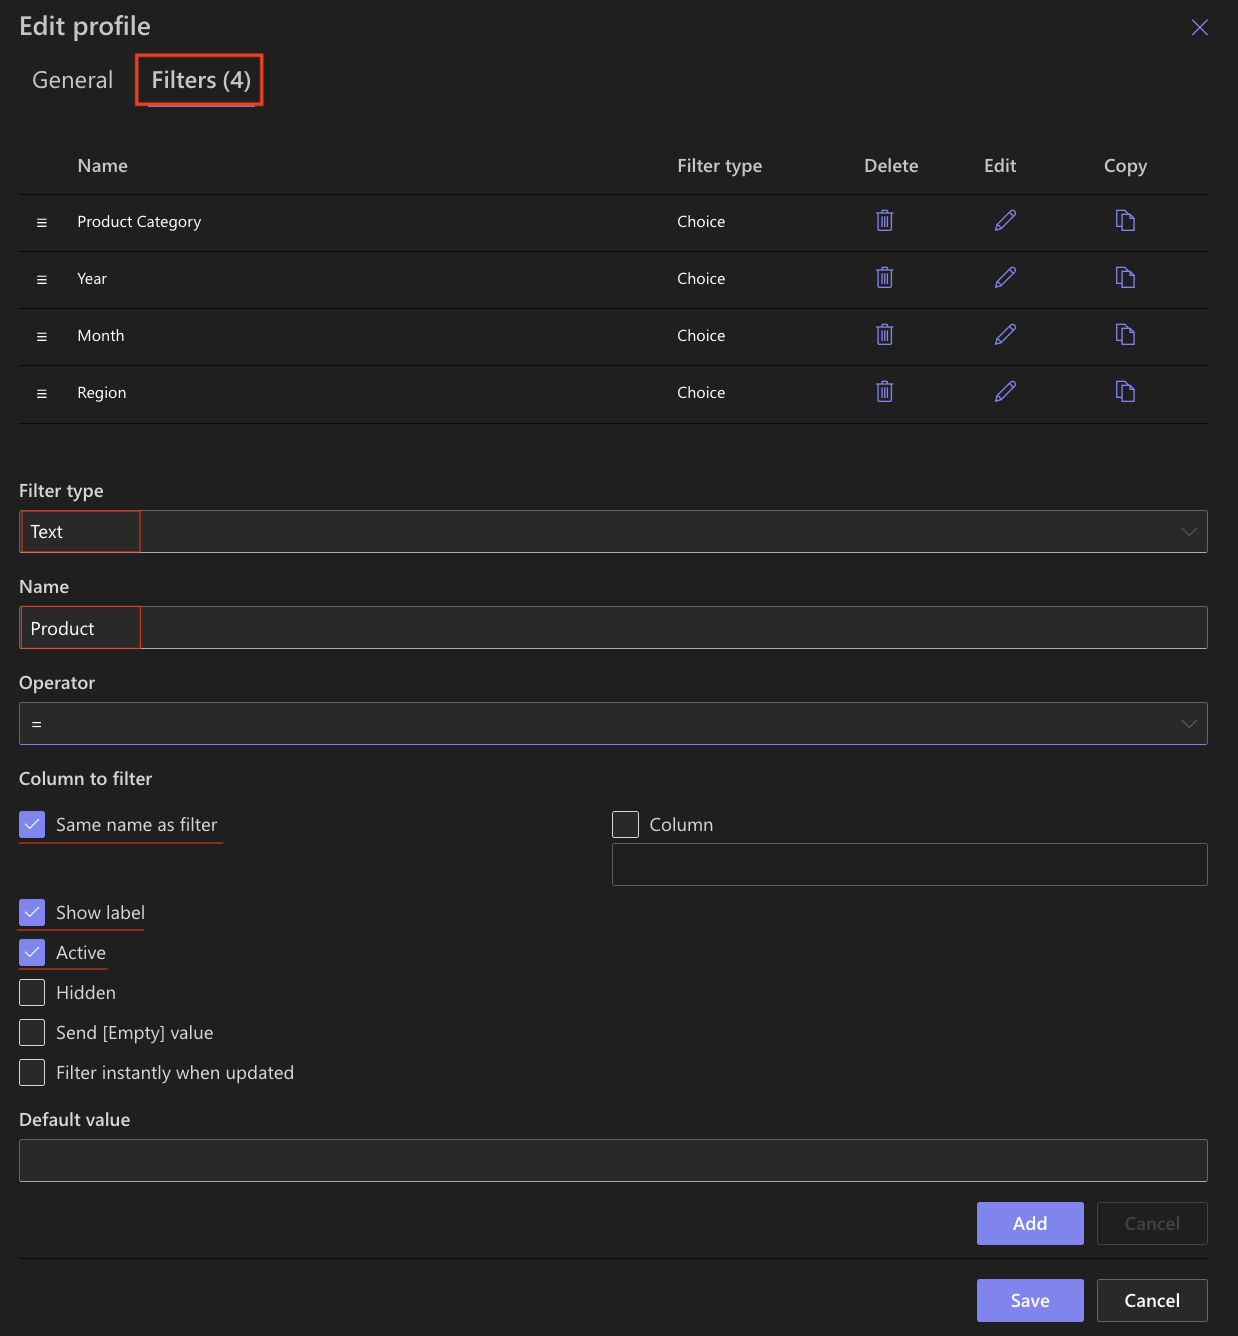
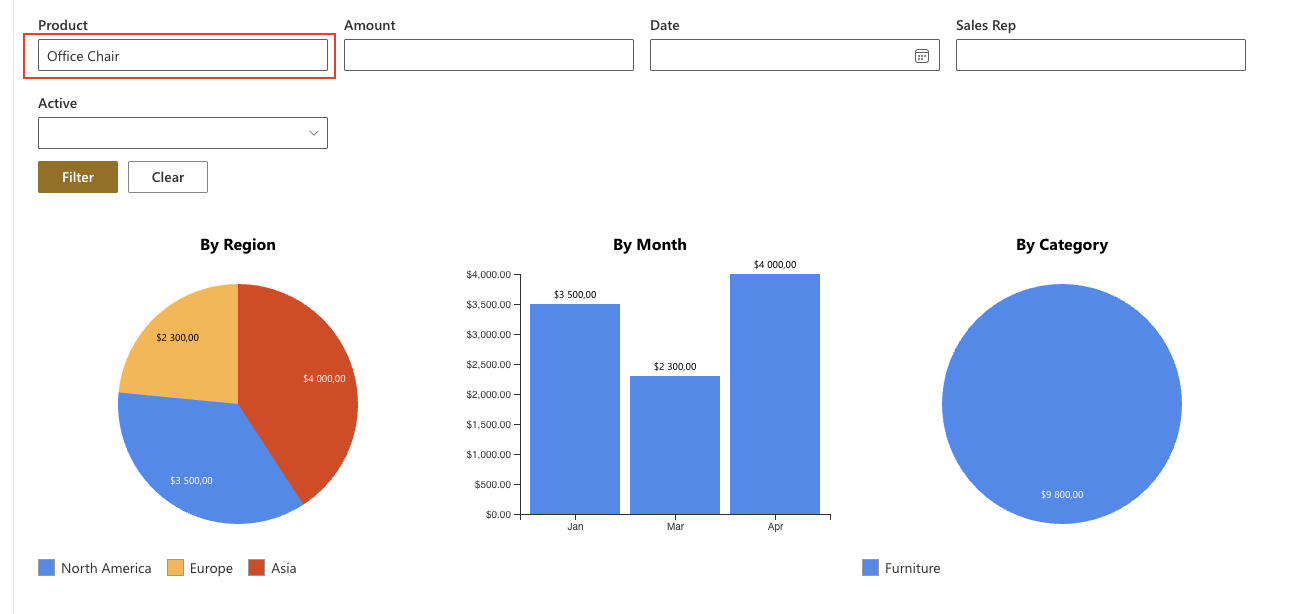
Users can type part of a product name (e.g., Office Chair) to filter data.
Step 3: Add a Number filter
Use a Number filter to define a value range.
- Filter type: Number
- Name: Amount
- Column to filter: Same name as filter
- Show label: Enabled
- Active: Enabled
- Minimum Value: 3000
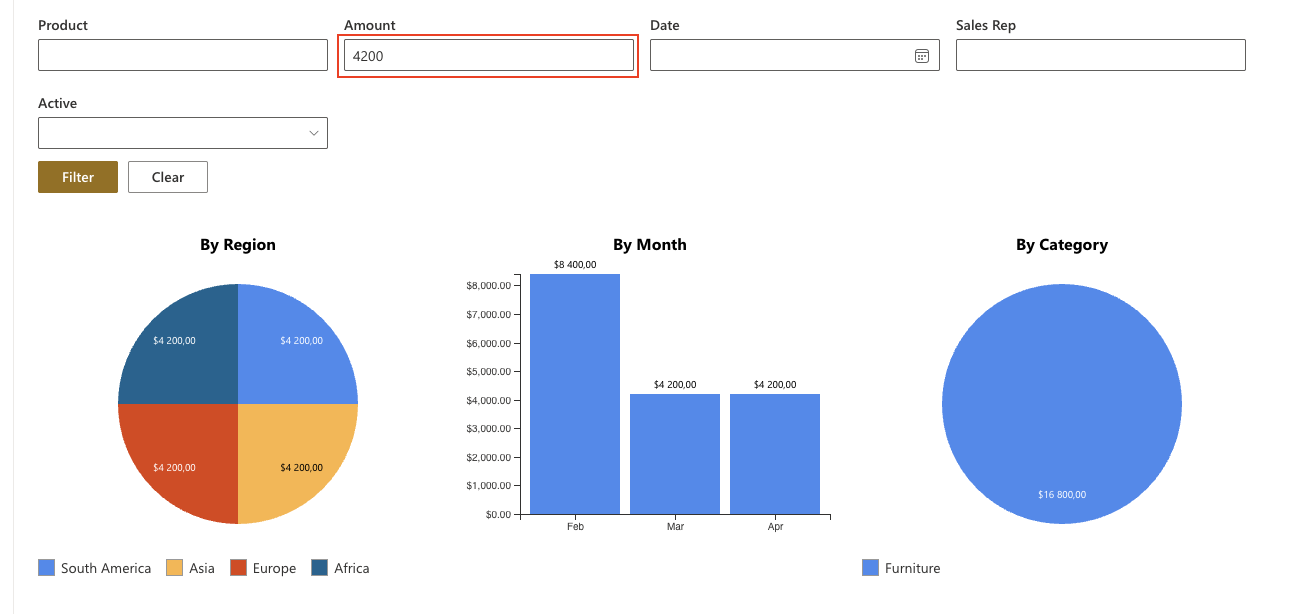
Example: show only sales above 3000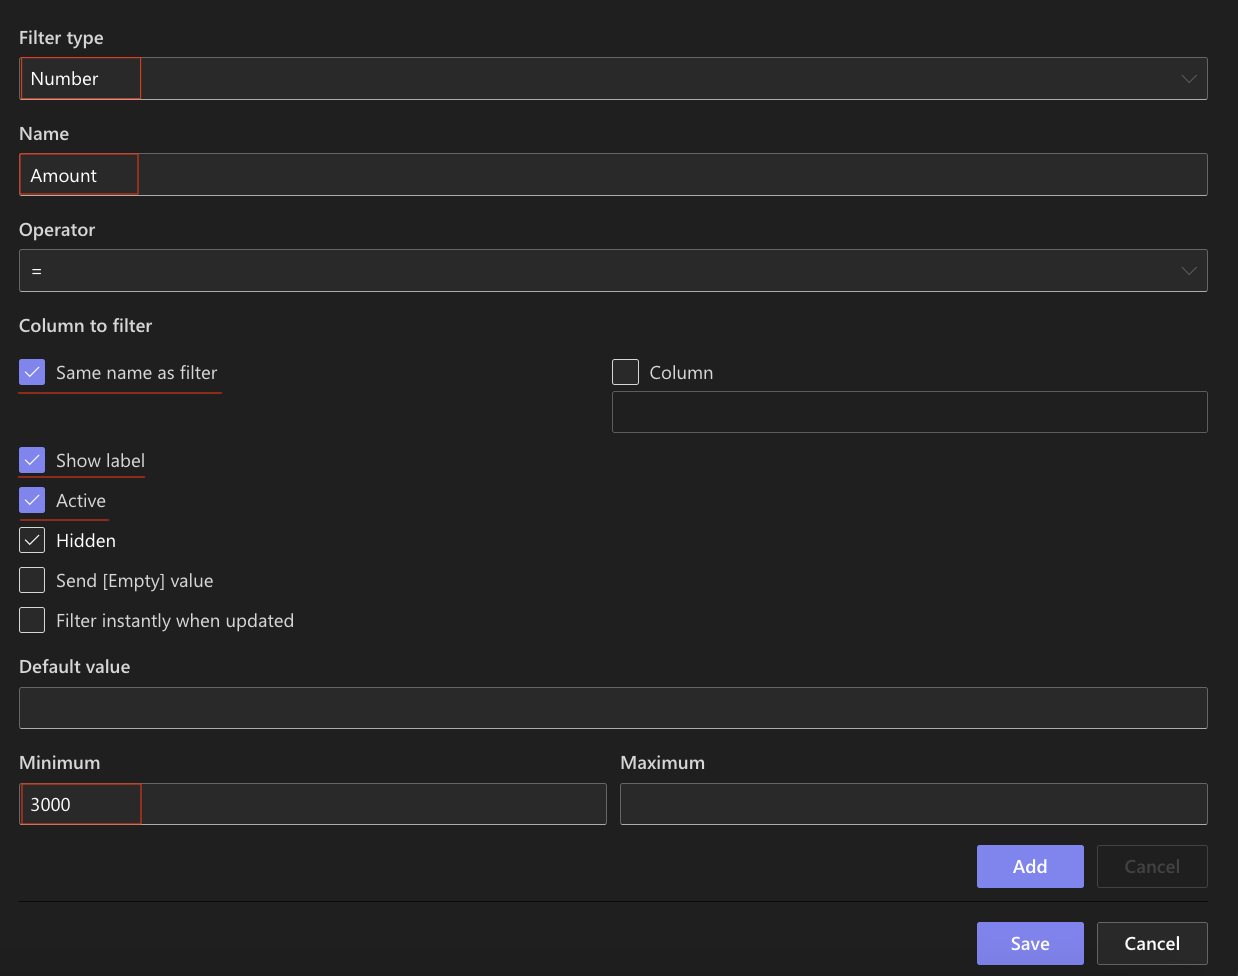
Step 4: Add a Date filter
Use a Date filter to work with date-based data.
- Filter type: Date
- Name: Date
- Column to filter: Same name as filter
- Show label: Enabled
- Active: Enabled
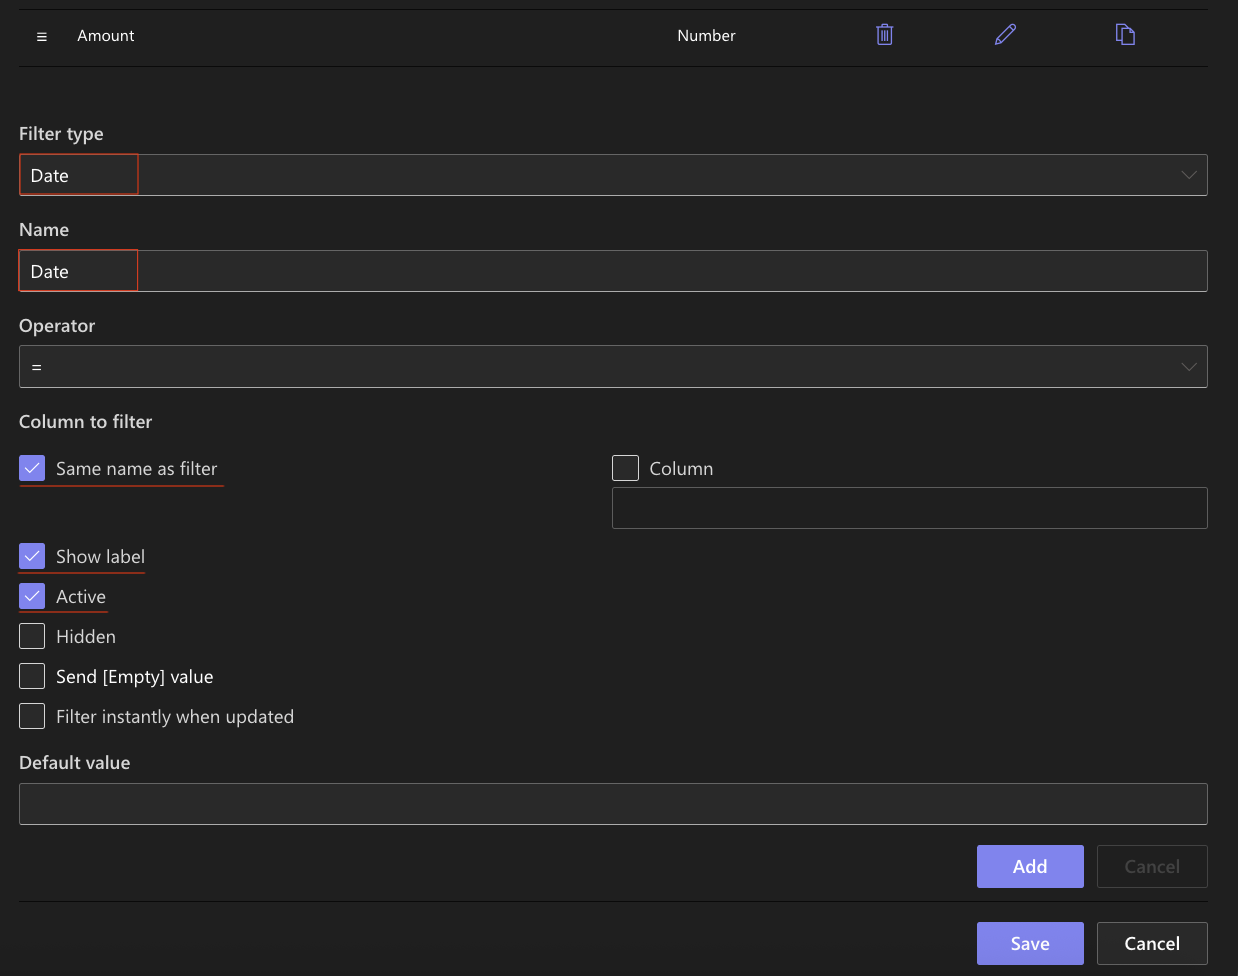
Users can select a specific date or range.
Step 5: Add a Person filter
Use a Person filter to filter by users.
- Filter type: Person
- Name: Sales Rep
- Column to filter: : Same name as filter
- Show label: Enabled
- Active: Enabled
- Allow multiple values: Enabled
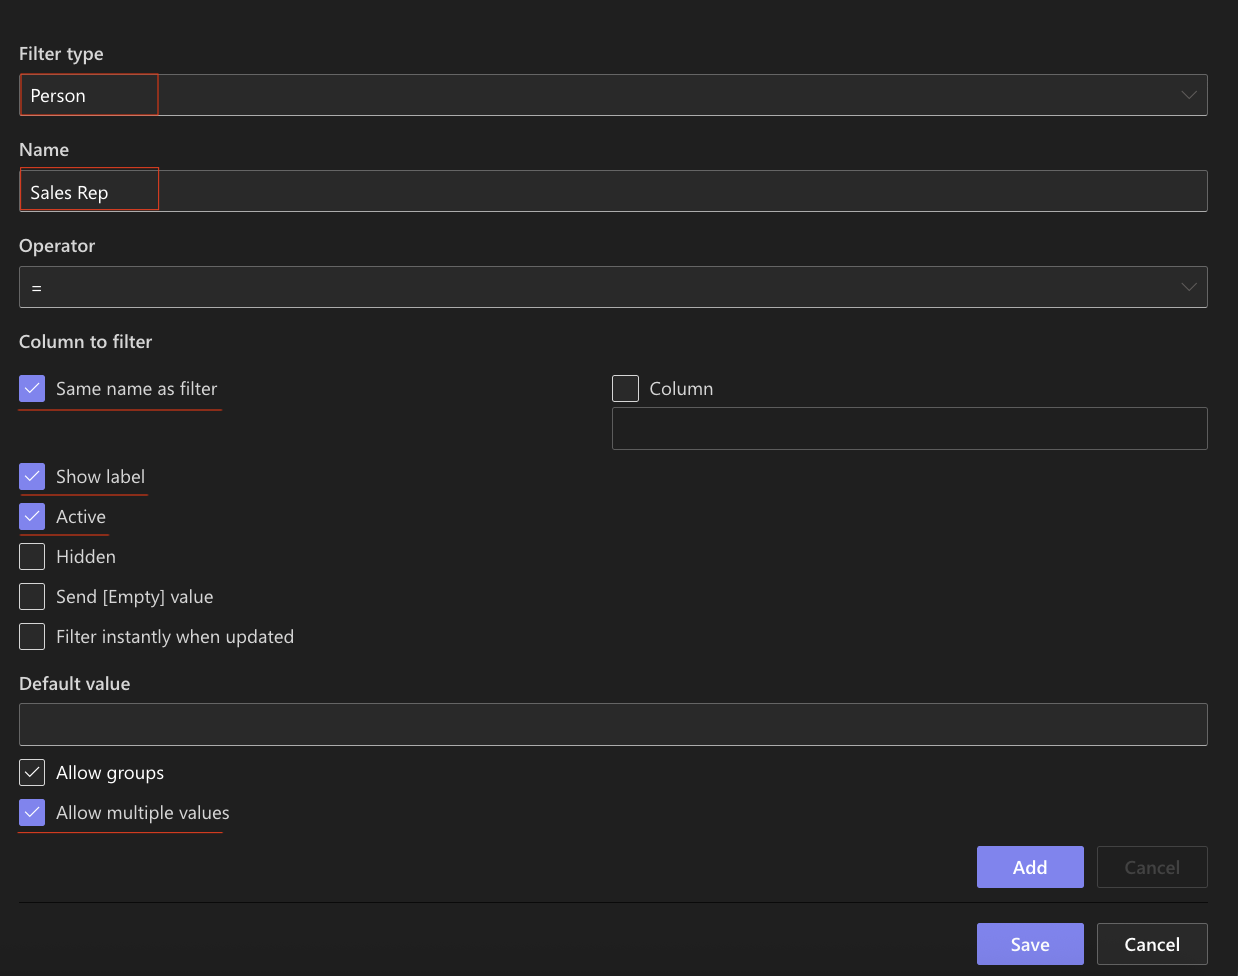
Useful for filtering data assigned to specific users.
Step 6: Add a Yes/No filter
Use a Yes/No filter for boolean values.
- Filter type: Yes/No
- Name: Active
- Column to filter: Same name as filter
- Show label: Enabled
- Active: Enabled
Example: show only active or inactive items.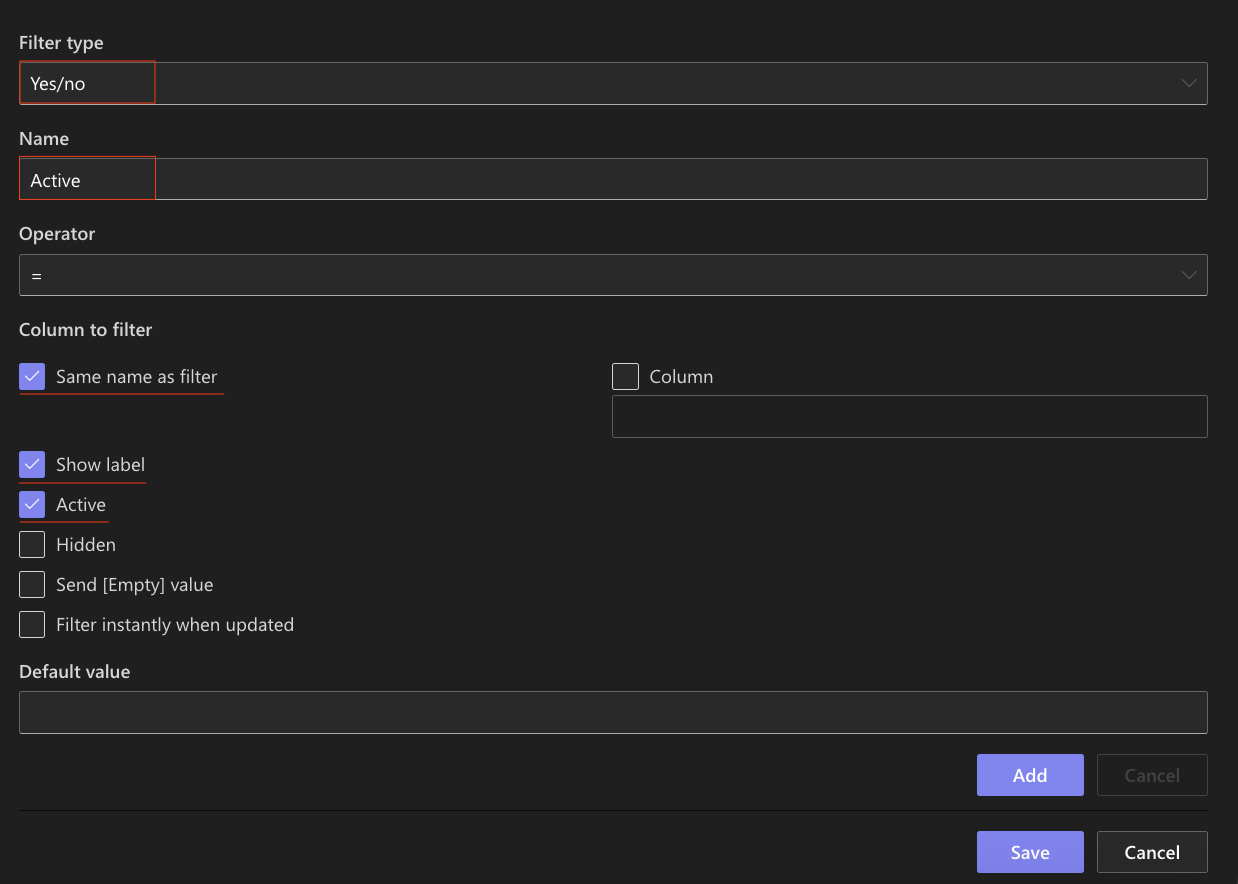
Step 7: Save and apply filters
- Click Save.
- Go back to the Sales Dashboard page and test the filters.
Step 8: Test different scenarios
Try different combinations:
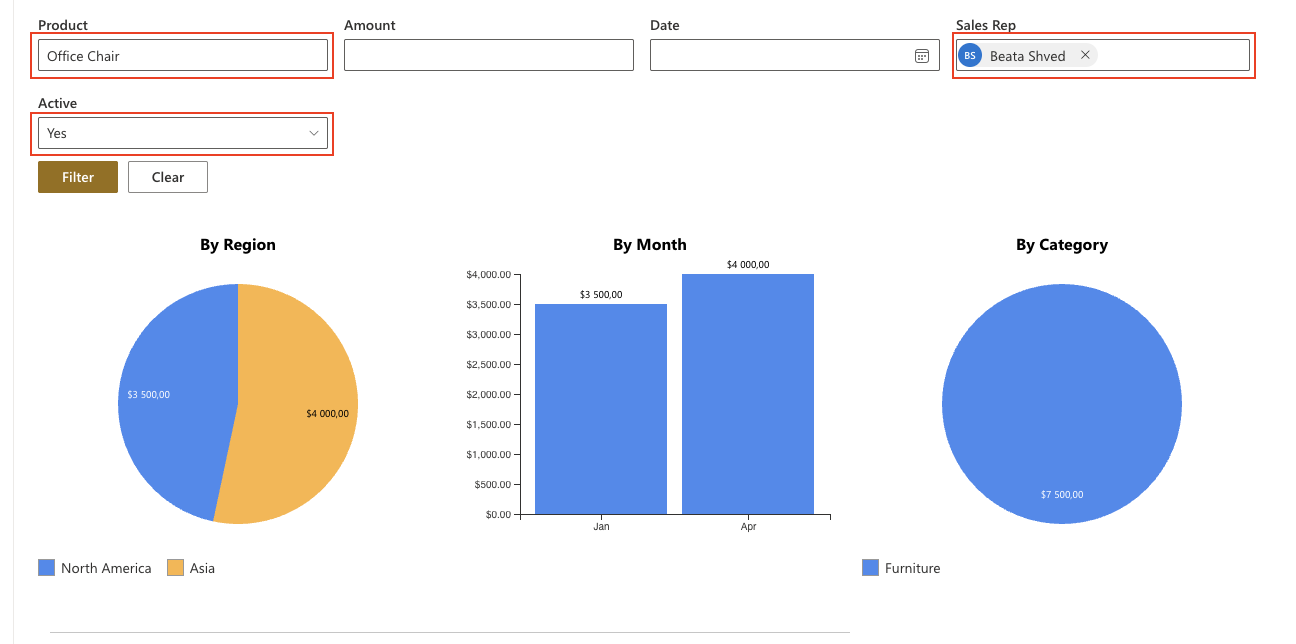
- Type “Office Chair” in Product → charts update
- Set Amount > 3000 → fewer results
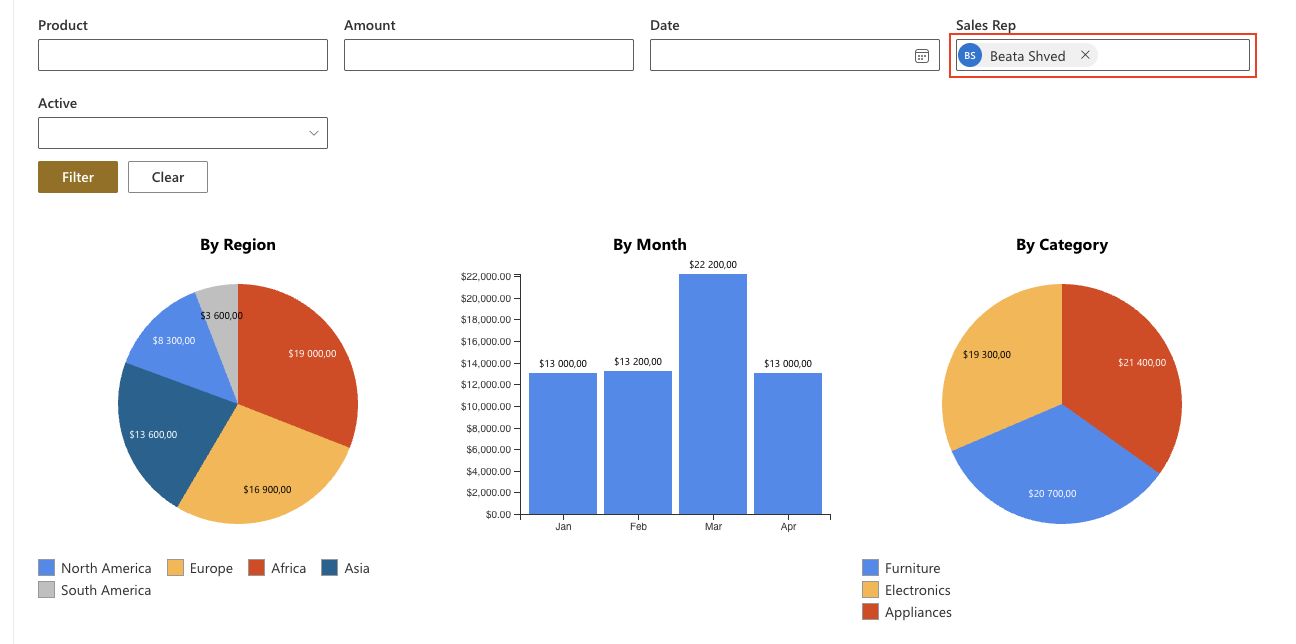
- Select a specific Sales Rep → filtered data
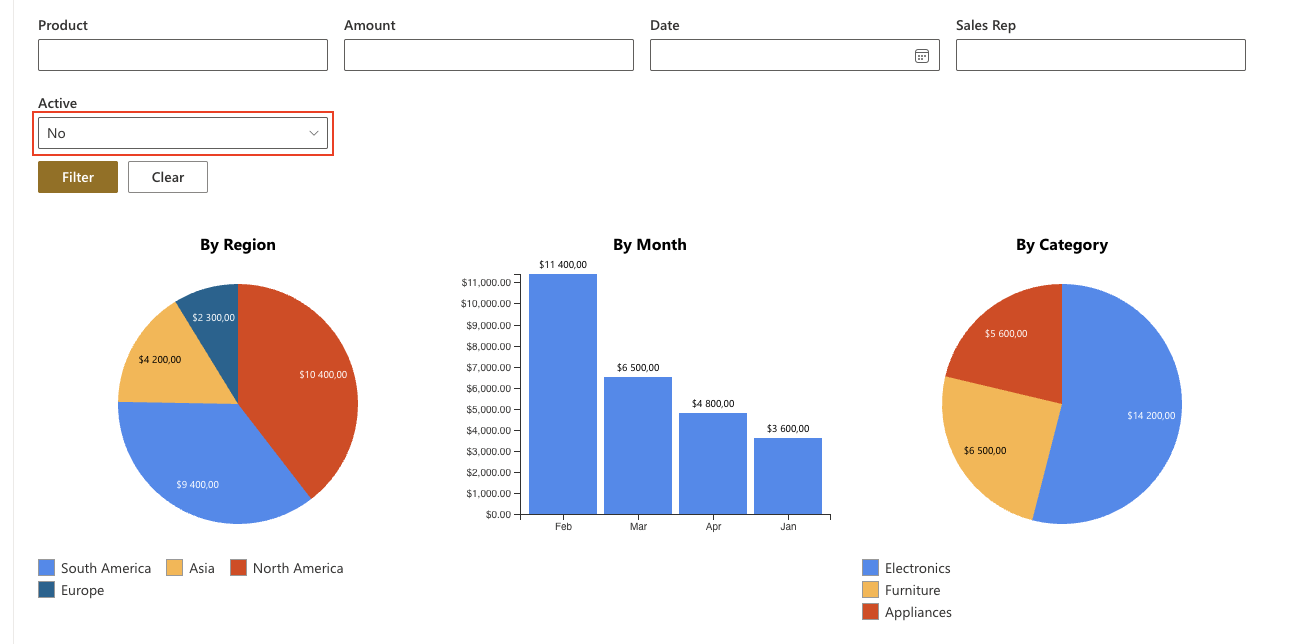
- Set Active = No → inactive items only
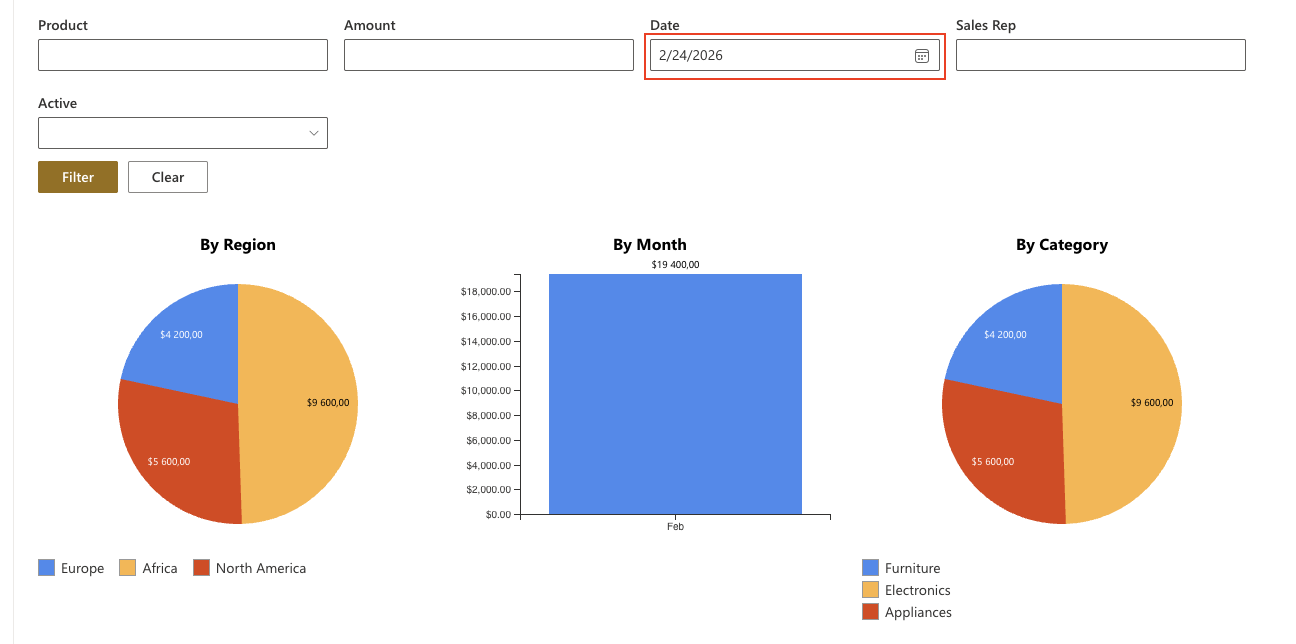
- Choose a Date → only items for that specific date are displayed
- You can also combine multiple filters to further refine the data and narrow down the results.
Result
The filter panel now includes multiple filter types that allow users to refine data in different ways.
Each filter dynamically updates the charts, making it easy to explore the data from different perspectives without reloading the page.
Summary
In this tutorial, you learned how to use different filter types in Ultimate Forms: Filters, including:
- Text
- Number
- Date
- Person
- Yes/No
You also learned how to simplify the filter panel by disabling unnecessary filters to improve the overall user experience.