Actions
Getting Started
Kickstart Training
Working with Dates
Form Designer
Tabs and Tab Permissions
Views and View Customization
Advanced Column Permissions
Item IDs
Associated Items
Print Formatting
Event Calendar
Connected Lookups
Voting Columns
List Search
Signature
Rollups
Counter
Charts
Import
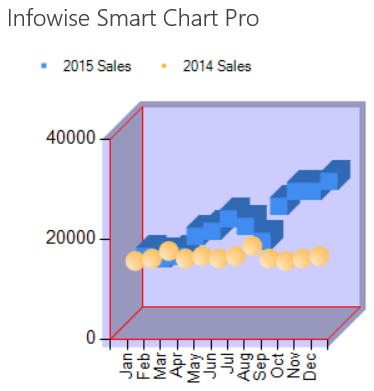
The bubble chart provides a unique view that visualizes data using "bubbles" or other 3D objects to signify the value on the chart.
Using a 3D setting on this chart type is effective when showing a comparison between two data series.
Here is example output for this chart type:
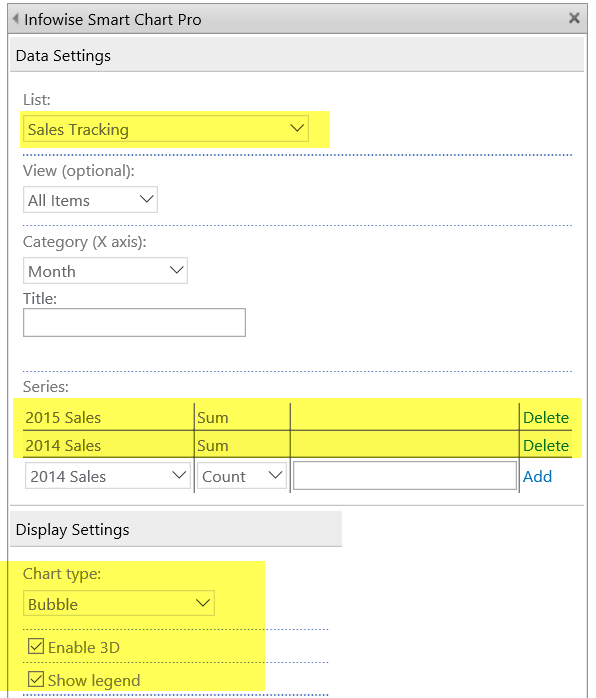
Instructions
Set up your chart following the steps from the Column Chart example.
Select the Bubble chart type.
Summary
The Bubble Chart provides a unique way to visualize the chart data that uses 3D objects.
Last modified: 5/8/2025 5:23 PM
Loading...
Add your comment
Comments are not meant for support. If you experiencing an issue, please open a support request.
Reply to: from