The following sections depict adding and configuring the Infowise Smart Chart web part to SharePoint pages in the On Premises environment. There are some differences between Infowise Ultimate Forms in On Premises and Infowise Ultimate Forms in Office 365. This page outlines the differences between the two so that users in Office 365 can follow along with the examples.
Instructions
Step 1: Adding the Infowise Smart Chart Pro Web Part
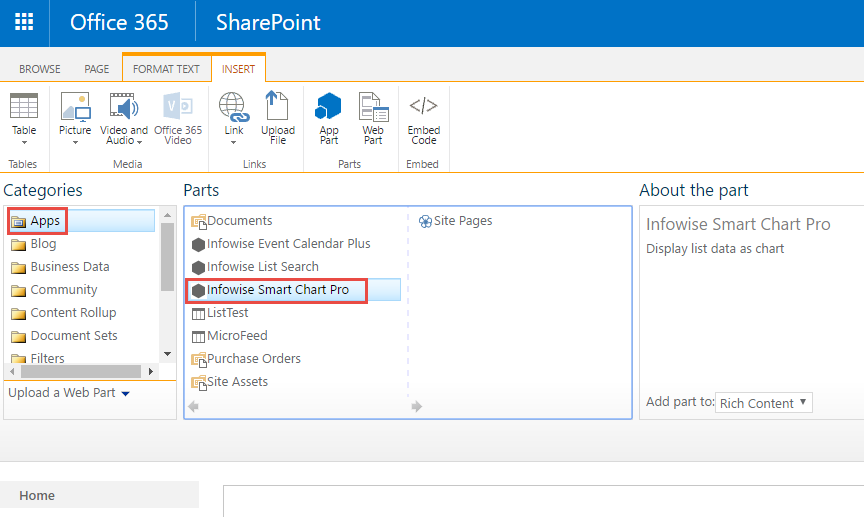
- Unlike the On Premises version, the Office 365 Infowise web parts are not located in a seperate folder. Instead they are available directly in the "Apps" folder as shown here:
Step 2: Configuring the Infowise Smart Chart Pro web part
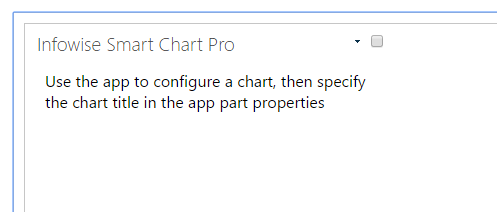
- In Office 365, once the Smart Chart Pro web part is added, it displays the following message by default.
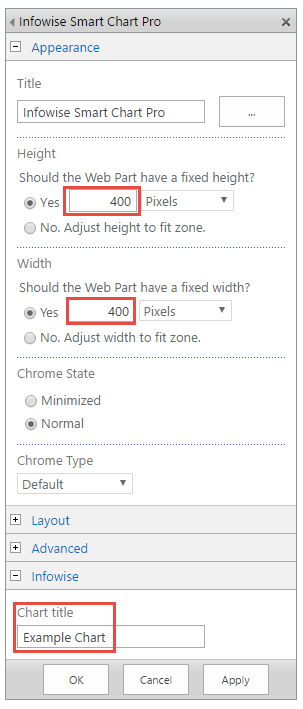
- Clicking Edit Web Part properties only gives one non-standard section: Infowise>Chart Title. All other settings must be made according to Step 3. The Chart Title must match exactly the profile name entered in Step 3. If the profile has not been created or has been misspelled then the web part will display the default message. It is a good idea to set the web part height and width to be equal to the height and width specified in Step 3.
Step 3: Configuring the Chart App Part
- Instead of configuring charts through the web part properties, charts are configured using the Configure App Parts section of the Infowise Design Screen shown here. Be sure to select the desired list or library in the Infowise Design Screen!
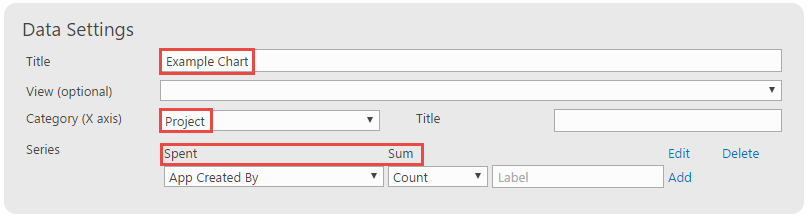
- Data Settings - This section is where the data for the chart is specified. One requirement is that the Title section must match the "Chart Title" section of the web part configured in step 2.
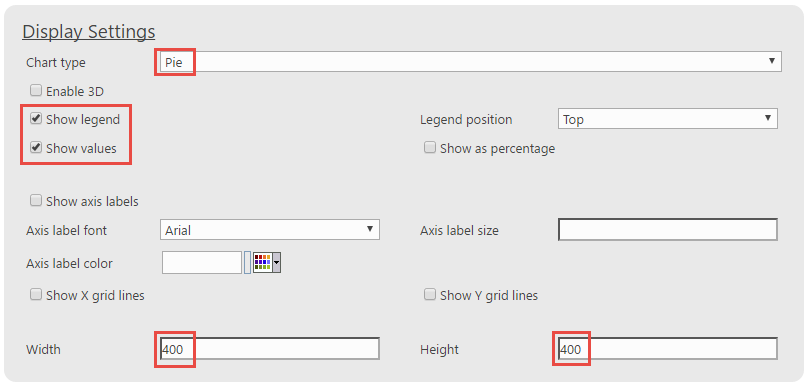
- Display Settings - This section in the chart type is configured as well as the chart style, axis colors, legend format, and chart size. It is good practice to match the Width and Height in the Display Settings to the Width and height in the Web Part Properties.
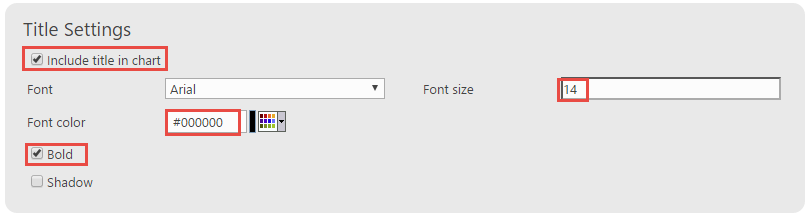
- Title Settings - This section is where the chart's title is configured.
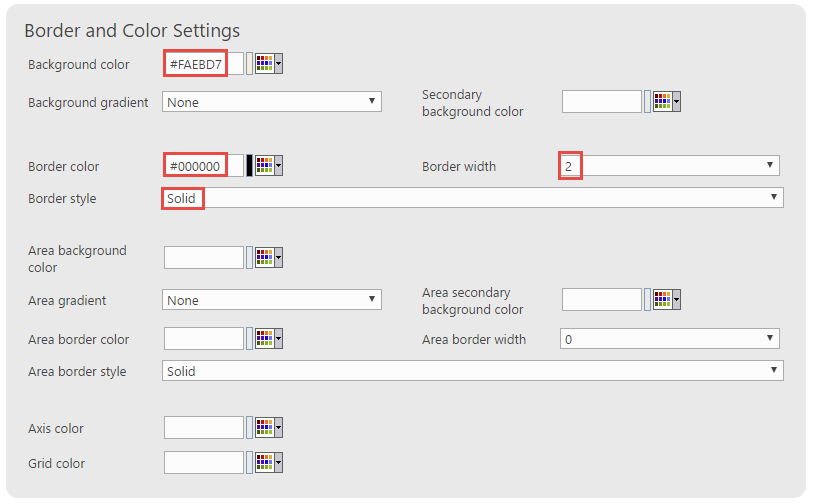
- Border and Color Settings - This section is where the chart border, area and grid colors are customized.
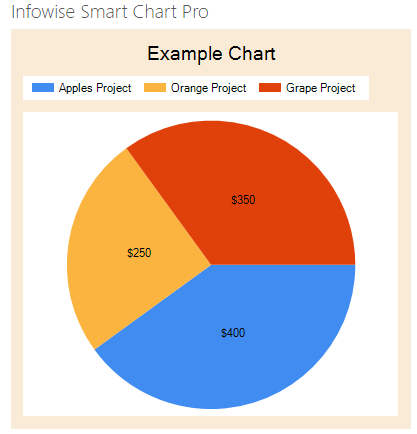
Once a Chart Profile has been added via the Infowise Design Screen and matched to the Chart Title in a Smart Chart Web Part, the web part will display the specified graph as seen here:
Summary
Now that you are familiar with the Office 365 Charting process, continue on to learn about all of the different chart styles. In the following sections.