The Counter web part allows you to display automatically calculated values from SharePoint lists directly on your pages.
Counters transform raw list data into clear, easy-to-read metrics that help users quickly understand what is happening without opening lists or running reports.
Each counter represents a single insight—such as a counts, sums, averages, minimum or maximum value—calculated in real time based on list data and optional conditions.
Counters are commonly used on dashboards, overview pages, and landing pages where key numbers need to be visible at a glance.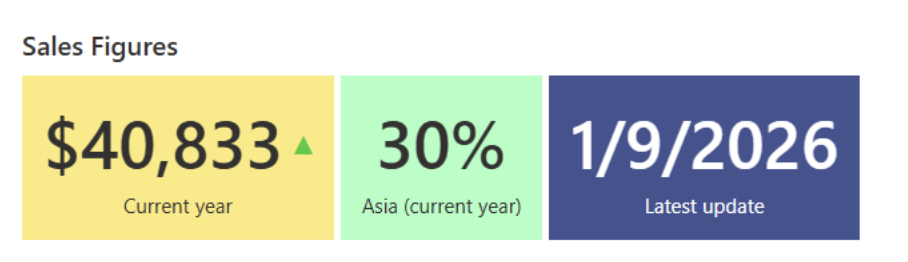
Instructions
What Are Counters
Counters are a visual component in Ultimate Forms, delivered through the Infowise Form web part, that calculate and display values based on SharePoint list data.
Each counter:
- is connected to a specific list
- targets a specific column
- applies an aggregation operation
Supported operations include:
- Count – displays how many items there are that satisfy the condition[s]. For example, number of open tasks
- Sum – adds up all the values from the queried items and displays the result. For example, total sales per year.
- Average – calculates the average number. For example, the average handling time for a support ticket
- Minimum / Maximum – displays the value, such as the highest individual sales quote per year.
Multiple counters can be displayed together, even when they are based on the same list or column but use different conditions.
How Counters Work
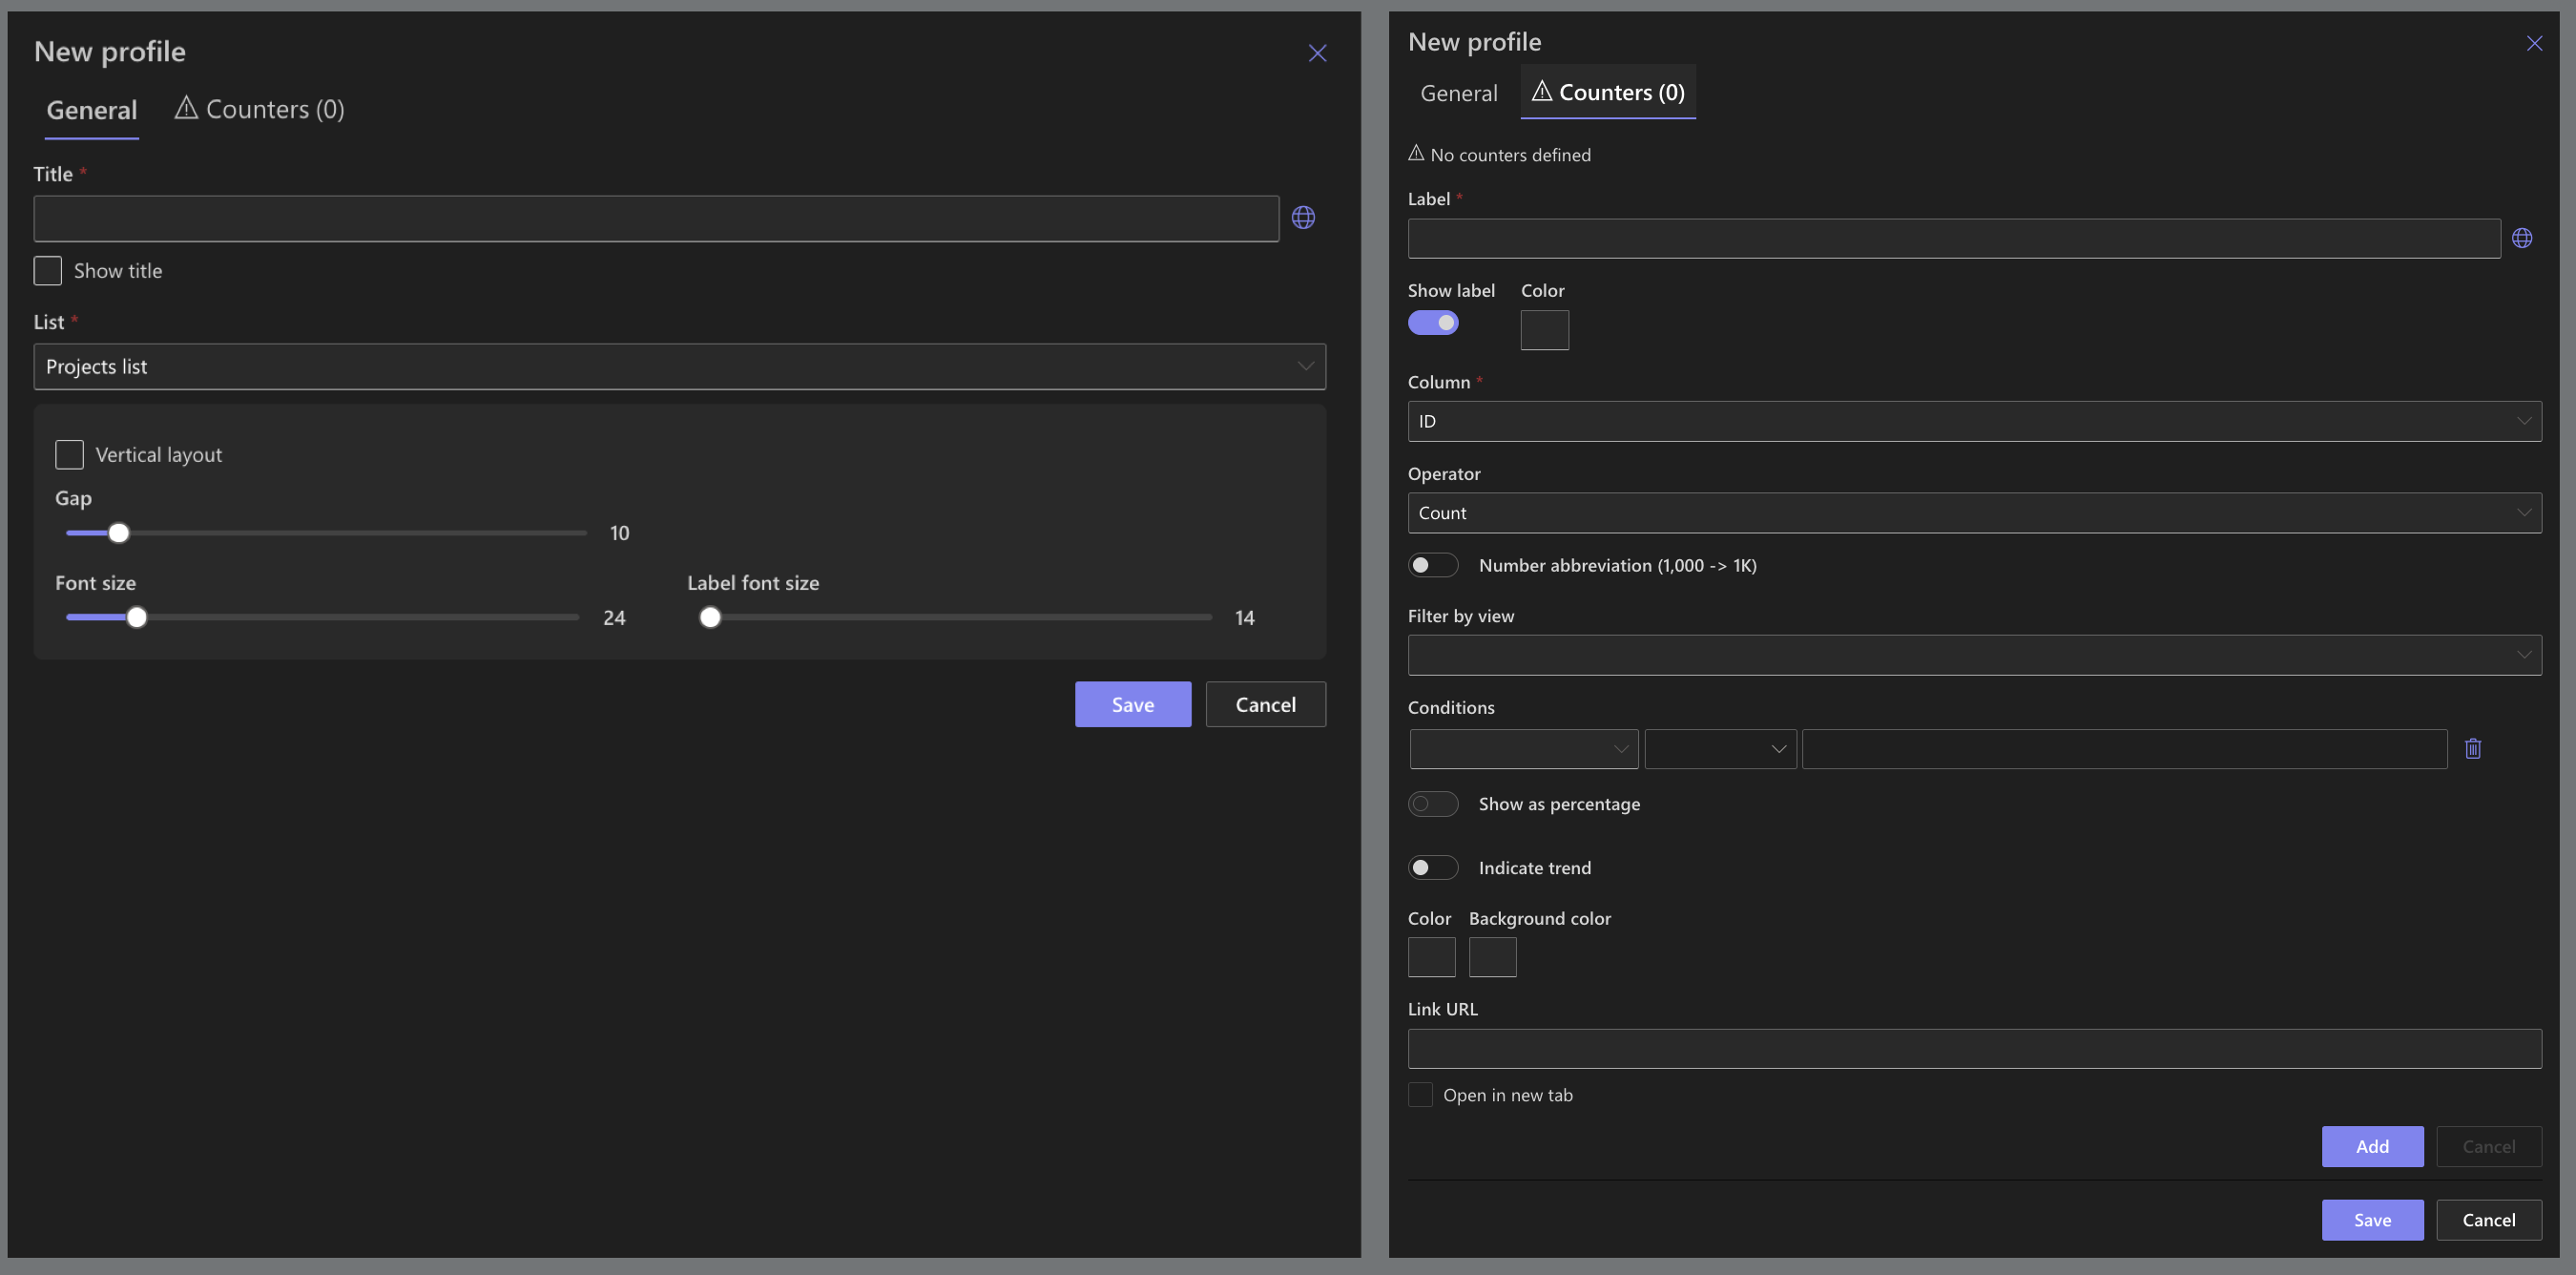
Using Counters is a two-step process:
- You create a Counters profile in Ultimate Forms
- You add Infowise Form web part and switch to Counter mode
The profile defines:
- which list is queried
- which counters are calculated
- what conditions or filters are applied
- how values are labeled and displayed
Once added to a page, counters automatically update whenever the underlying list data changes.
Filtering and Conditions
Counters can be configured to focus on specific subsets of data.
You can:
- filter by list view
- apply conditions to columns (for example, Status = Open)
- combine conditions to narrow results
This makes it possible to show highly targeted metrics, such as:
- number of open tickets
- total sales for a specific region
- average resolution time for active cases
Make sure to index the columns used in conditions if your list contains over 5,000 items to prevent throttling.
Advanced Counter Capabilities
Counters support additional options that enhance how data is interpreted:
- Trend indicators
Show whether a value increased or decreased compared to a previous value, such as the previous month or year. - Percentage counters
Display values as a percentage of a defined total, helping users understand proportions rather than raw numbers. - Labels and localization
Each counter can include a custom label with support for multiple languages.
When to Use Counters
Counters are ideal when you need:
- instant visibility into key numbers
- lightweight KPIs without external reporting tools
- real-time metrics driven by live SharePoint data
- dashboard elements that complement lists, Rollups, or Charts
They are especially effective when combined with other Ultimate Forms components to create informative and actionable pages.
Watch this quick video walkthrough from Infowise:
Summary
Counters provide a simple and powerful way to surface meaningful metrics from SharePoint lists. By displaying live counts, sums, averages, and trends directly on a page, Counters help users focus on what matters most and make faster, better-informed decisions.