Forms
Actions
Alerts
Associated Items
Connected Lookup
Print
Import
Signature
External Data Lookup
Calendar
Rollups
Charts
List Search
Filters
Item IDs
Color Choice
User Property
Document Link
Voting
Stay in the know
Get helpful videos
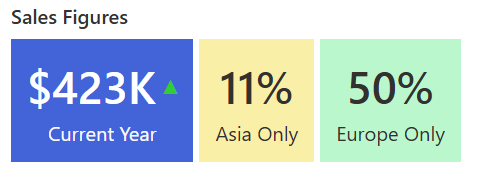
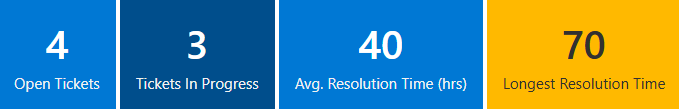
Display visual summary of list data as striking colorful counters

- Display multiple counters together
- A counter can count and summarize column values in list items
- Works on all or filtered items, according to conditions
- Display trends with a positive or negative indicator
- Display values as percentage of the whole
- Support for multiple languages and translations
Select a list, then add one or more counters. Each counter can be based on a different value column, have a different color scheme and include its own conditions.
Features
| UltimateForms | SharePoint Native | |
|---|---|---|
| Display summaries for any list | ✓ |
|
| Automatically calculate based on conditions | ✓ |
|
| Show trends based for instance on the previous period | ✓ |
|
| Show as percentage of the total | ✓ |
|
| You can provide label translations for multiple languages | ✓ |
Screenshots