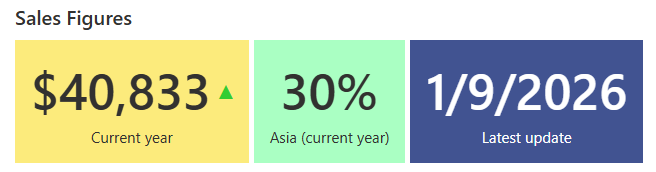
A counter is the smallest useful dashboard: one live number, computed from a SharePoint list, displayed where people look. The Counters web part in Ultimate Forms builds them without code: counts, sums, averages, minimums, and maximums, filtered any way you need, updating as the data changes.
This is the reference for everything the web part does: the operations, the filters, the trend arrows and percentages, the drill-through links, and the setup. For where counters fit in a full dashboard, see the ten dashboards guide, and for the dashboard-building approach itself, counters as building blocks.
A short introduction video:
What a counter computes
Each counter connects to a column in a list and applies one operation.
Count answers "how many": items where Status equals Open, tickets where Priority equals High, submissions created this week.
Sum adds the numbers: total sales this quarter, total spend this month, hours logged on the project.
Average shows the typical value: average resolution time, average deal size, average cost per vendor.
Minimum and maximum find the edges: the largest single sale, the longest delay, the oldest unresolved ticket.
Date columns work too, so a counter can surface the nearest deadline or the most recent submission. And because each counter is one number with one job, a row of four tells a story no single report does: how many, how much, how typical, how extreme.
Filters decide what counts
A counter without a filter summarizes the whole list. The filters are where it becomes yours.
Conditions scope the counter to the items that matter: Status equals Open, Region equals Europe, Amount above the threshold, dates within the range, items assigned to the current user. A list view can serve as the scope instead, reusing filtering you already maintain.
Counters with different filters sit side by side for comparison: this month against last month, Europe against the Americas, open against overdue. And on a page carrying the Filter web part, the counters respond to it, so one dashboard serves every team: pick a department, and every number on the page recalculates.
The displays that add meaning
Two display options turn a number into an interpretation.
Trend indicators compare the value to a previous period and show the direction: an arrow up or down beside the number. "Forty-two open tickets" is information; "forty-two, trending down" is reassurance. The viewer learns whether things are improving without anyone computing it.
Percentage displays divide the counter's value by a total you configure. Sales from one region as a share of all sales. Completed tasks as a share of the project. Where the raw number needs context to mean anything, the percentage carries the context with it.
Appearance is configurable per counter: colors, icons, and styling, so the overdue counter can be the red one, and the dashboard reads at a glance before anyone reads a label.
Every counter is a door
A counter can carry a link, opening in the same or a new tab. Point it at the list view that shows the underlying items, and the number becomes navigation: click "12 pending approvals" and land on the twelve.
This is the detail that separates a dashboard from a poster. Viewers do not just learn that twelve items are pending; they are one click from working on them, with their own SharePoint permissions applied on arrival. The navigation pattern, counters as the front page of a whole solution, is the subject of the building-blocks article.
Four counters that tell a story
The operations combine naturally. One scenario per operation shows the shape.
A support dashboard leads with a count: open tickets, filtered to Status not Closed. Beside it, an average: resolution time in hours, the number the SLA cares about. Then a maximum: days unresolved on the worst ticket, the one that needs a name next to it. A trend arrow on the count says whether the queue is winning or losing.
A sales dashboard leads with a sum: the quarter's revenue. A filtered sum beside it: Europe's share, displayed as a percentage of the total. An average deal size watches quality while the sum watches volume, and a maximum, the largest single sale, gives the quarter its headline.
A procurement dashboard runs the same shape on money: total spend this month as the sum, pending approvals as the count, average vendor cost as the baseline, and the highest single invoice as the number worth a second look. The pending-approvals counter linked to its filtered view is the one managers click daily.
A project dashboard runs it on time: tasks remaining as the count, tasks completed beside it for the ratio, average task duration as the planning input, and the longest delay as the risk flag. A percentage display on completed-versus-total turns the pair into a progress figure.
The pattern across all four: pick the numbers your team argues about, and the dashboard settles the argument every morning.
Choosing the numbers
The web part makes counters cheap, which creates its own hazard: the dashboard with fourteen of them, where nothing stands out because everything does.
Three habits keep a counter row sharp. Lead with the numbers that trigger decisions, not the ones that merely exist; "overdue items" earns its place because someone acts when it rises, while "total items ever" rarely moves anyone. Keep the row to four or five, and let the drill-through links carry the detail. And give each counter a threshold meaning through color: the green-to-red shift should match the point where the team would actually intervene.
One more habit pays off over time: when a counter stops being looked at, remove it. A dashboard is a claim about what matters, and keeping it honest is what keeps it opened.
Setting one up
The build takes minutes:
- Create a counter profile in the Ultimate Forms administration interface.
- Pick the list to query.
- Add one or more counters to the profile: the column, the operation, and any filters.
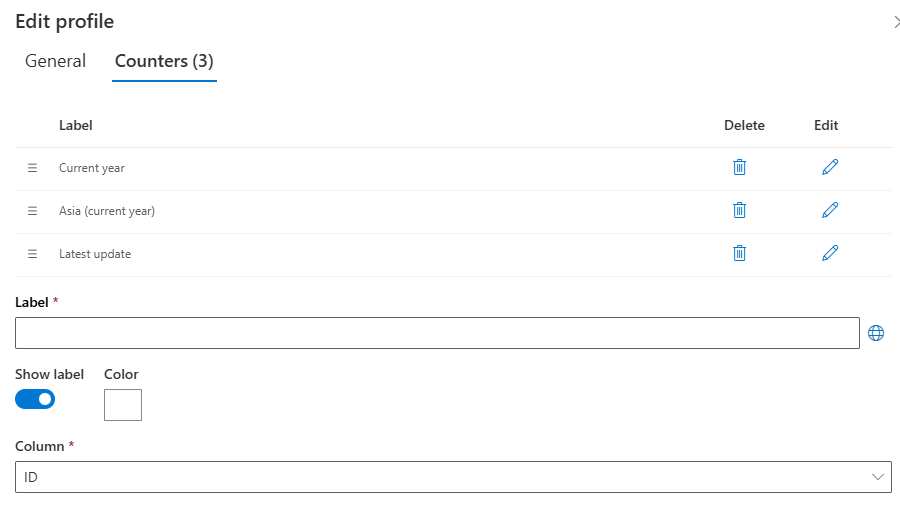
- Add the Infowise Form web part to a SharePoint page, switch it to Counter mode, and select your profiles.
The numbers are live from that moment. Profiles are reusable across pages, and copying a counter to adjust its filter is the fast way to build a row of them. When the row is in place, a chart below it carries the trend and rollups extend the reach across lists and sites, the full assembly covered in the ten dashboards guide.
Placement is the last decision, and the simplest rule wins: put the counters where people already look. The team site home page beats a dedicated dashboard page nobody bookmarks. A row of counters above the list beats a separate report. The best dashboard is the one that interrupts a page someone was opening anyway.
The result asks nothing of its viewers and nothing of its owner. The list changes, the numbers follow, and the question "how are we doing right now" has a permanent answer on the page where everyone already works. The owner who built it in an afternoon adjusts it in minutes, which is the whole economic argument: visibility priced at configuration, not development.
Frequently asked questions
Add your comment