
10 SharePoint Dashboards You Can Build Without Power BI
In our previous article, we explored why many SharePoint reporting requirements don't actually require the complexity of Power BI. While Power BI remains an outstanding business intelligence platform for advanced analytics and developers, many organizations simply need an easy way to visualize data already stored in SharePoint.
With Infowise Ultimate Forms, you can create interactive dashboards directly within SharePoint using no-code components such as KPI counters, charts, gauges, progress indicators, filters, and rollup summaries. These dashboards provide immediate visibility into business data without requiring users to leave SharePoint or learn another application.
To illustrate what's possible, here are ten examples of dashboards that can be built entirely within SharePoint using Ultimate Forms.
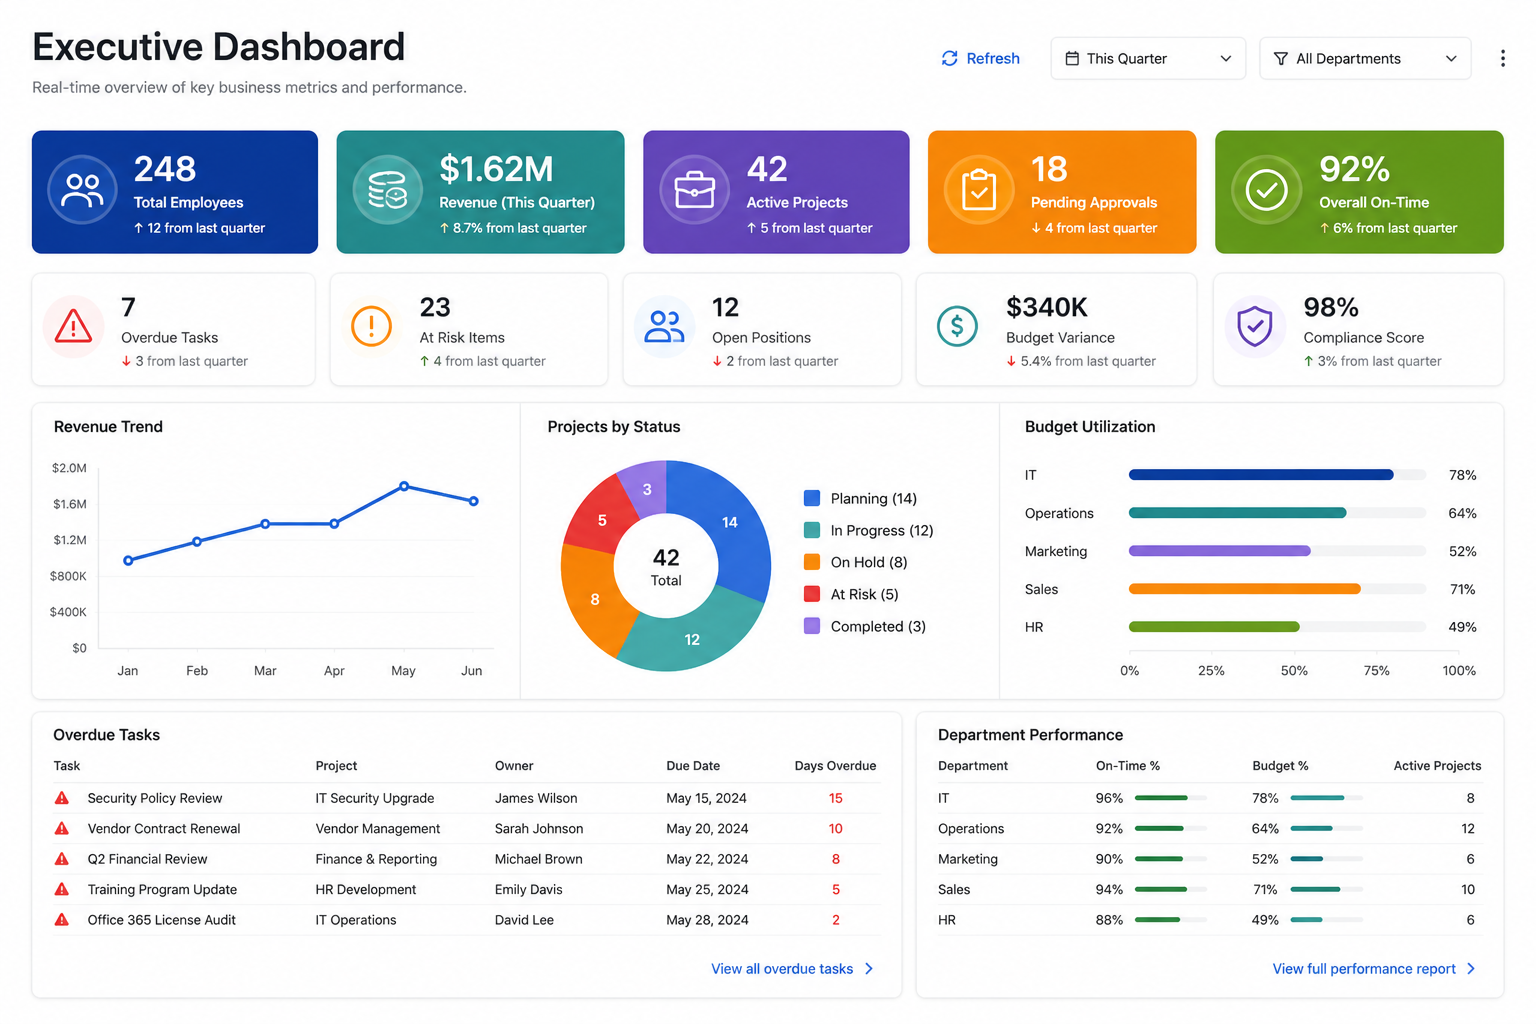
1. Executive Dashboard
Provide leadership with an instant snapshot of organizational performance. Display key metrics such as active projects, outstanding approvals, overdue tasks, budget totals, and departmental KPIs using counters, charts, and progress indicators that update automatically.
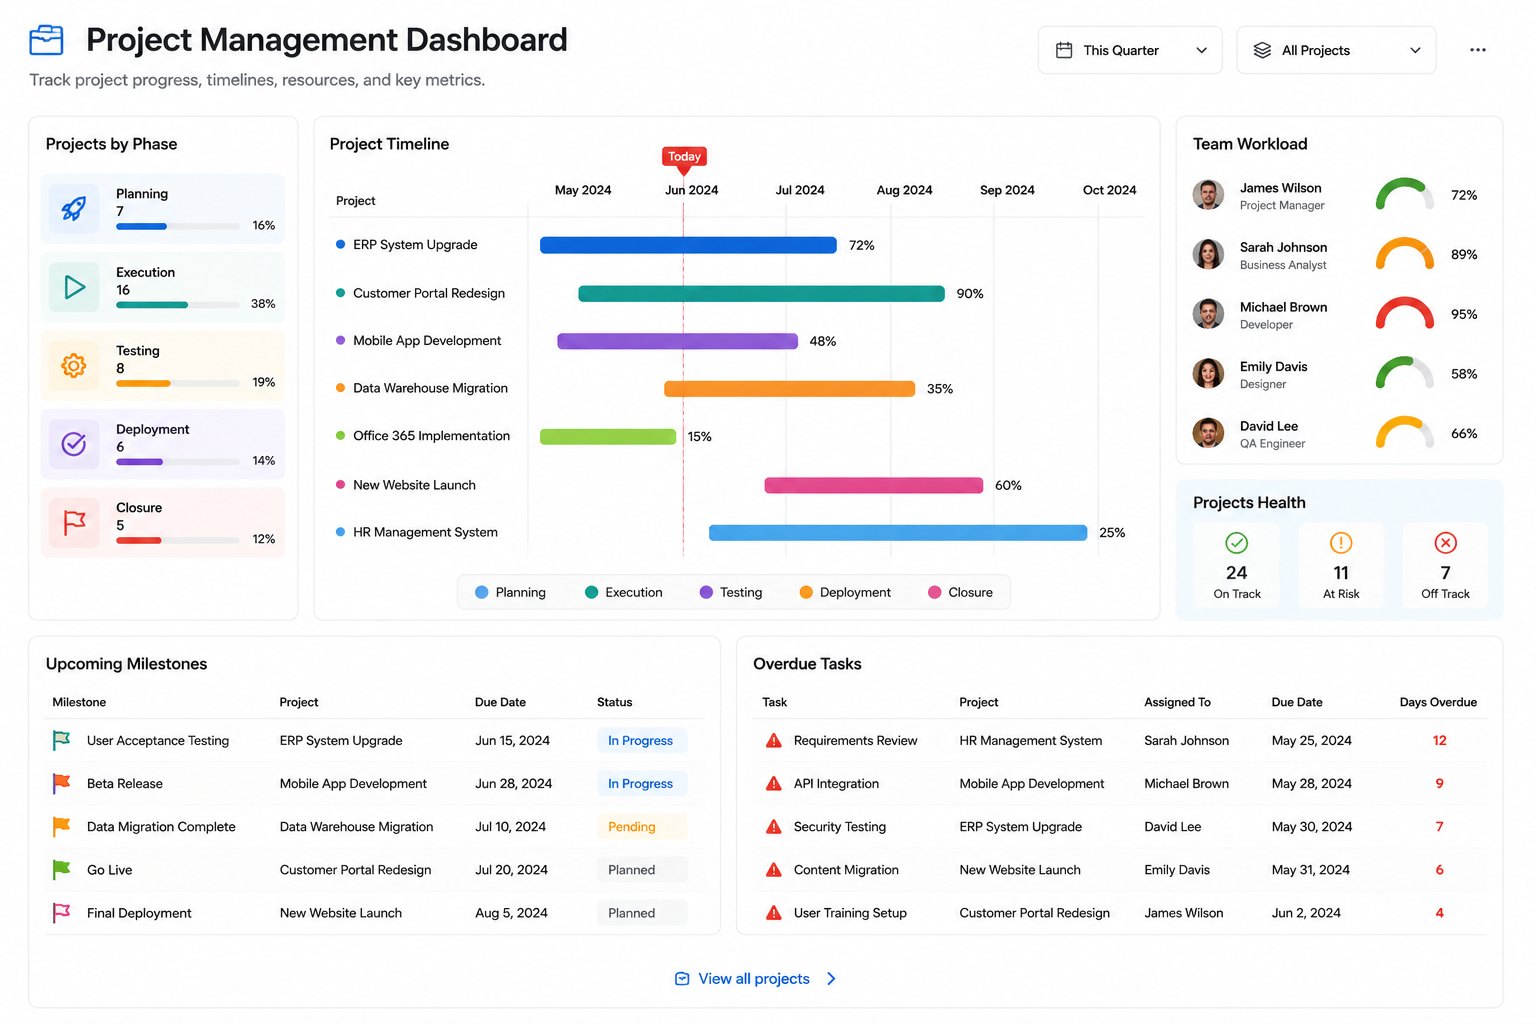
2. Project Management Dashboard
Keep project managers informed with a centralized view of every project. Display projects by phase, upcoming milestones, budget utilization, overdue tasks, resource allocation, and completion percentages to quickly identify projects requiring attention.
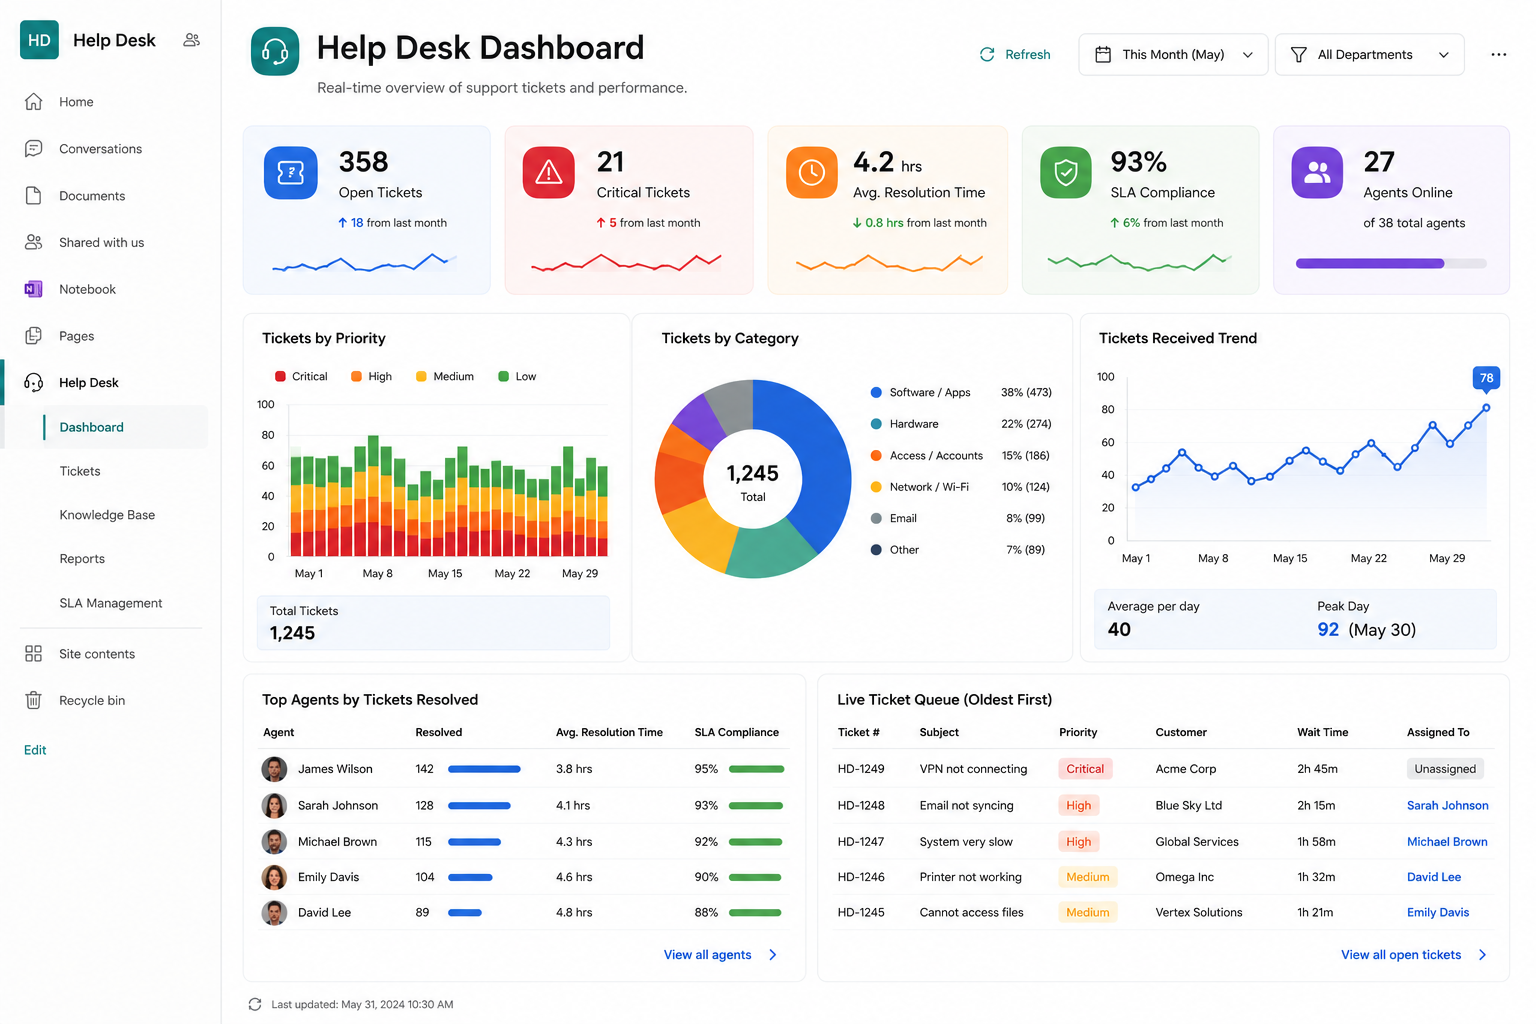
3. Help Desk Dashboard
Monitor support operations with real-time service metrics. Display ticket counts by status and priority, average resolution time, technician workload, SLA compliance, and trends in incoming requests to improve customer support performance.
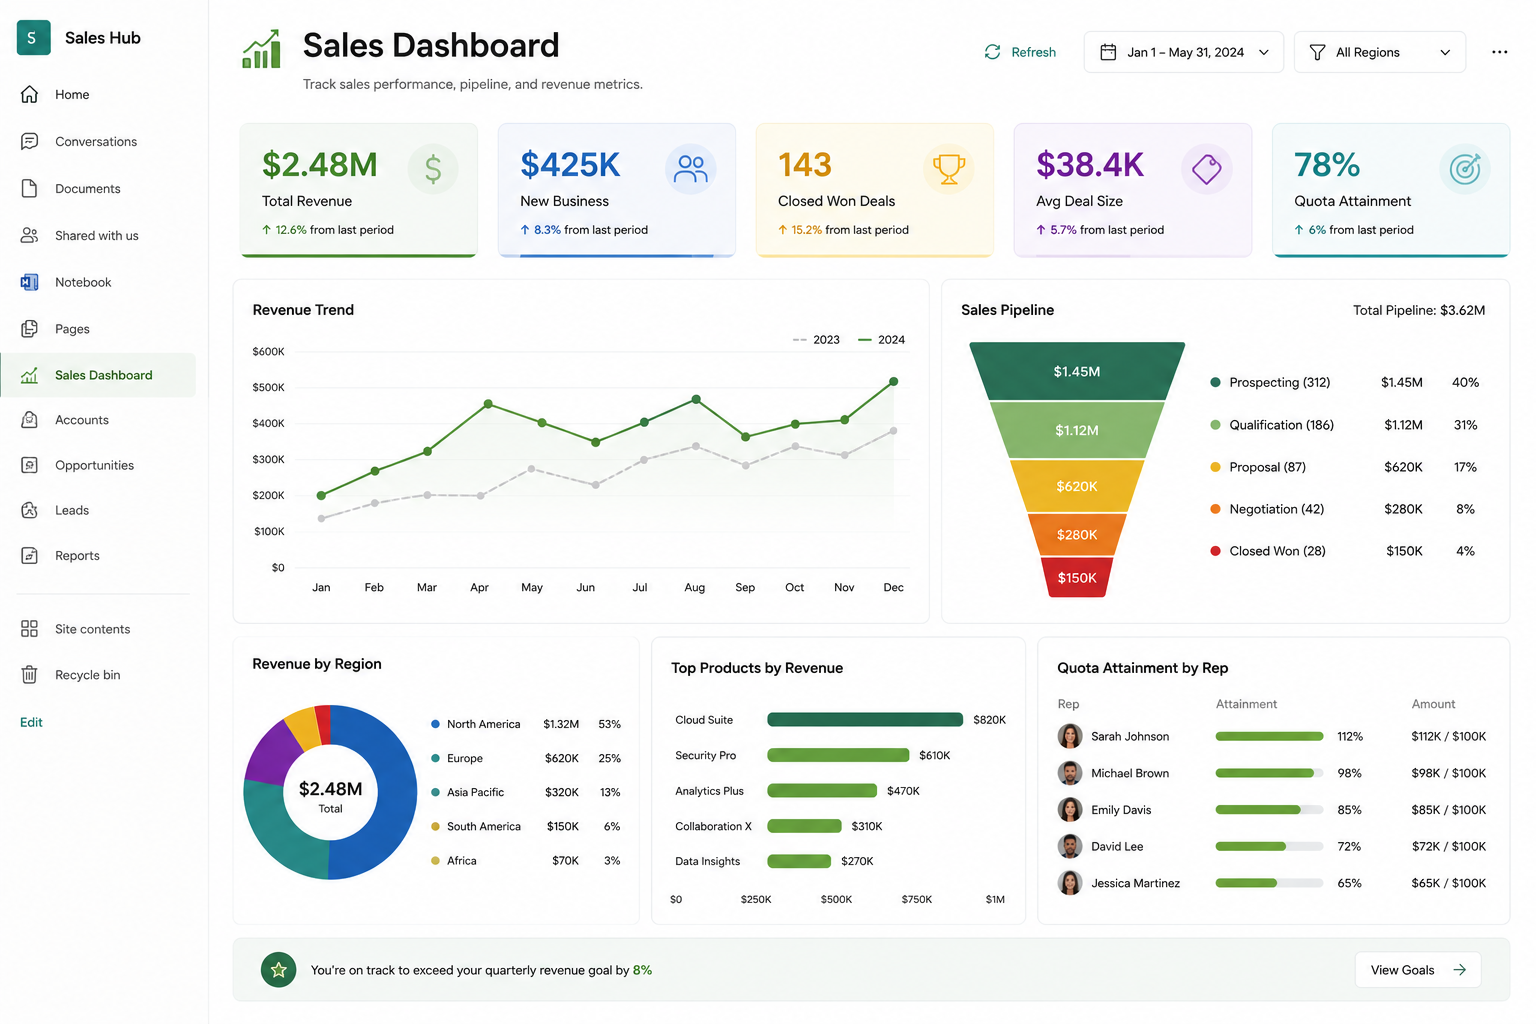
4. Sales Dashboard
Track sales performance without exporting data into external reporting tools. Display revenue totals, monthly sales trends, product categories, regional performance, sales pipeline metrics, and progress toward quarterly goals.
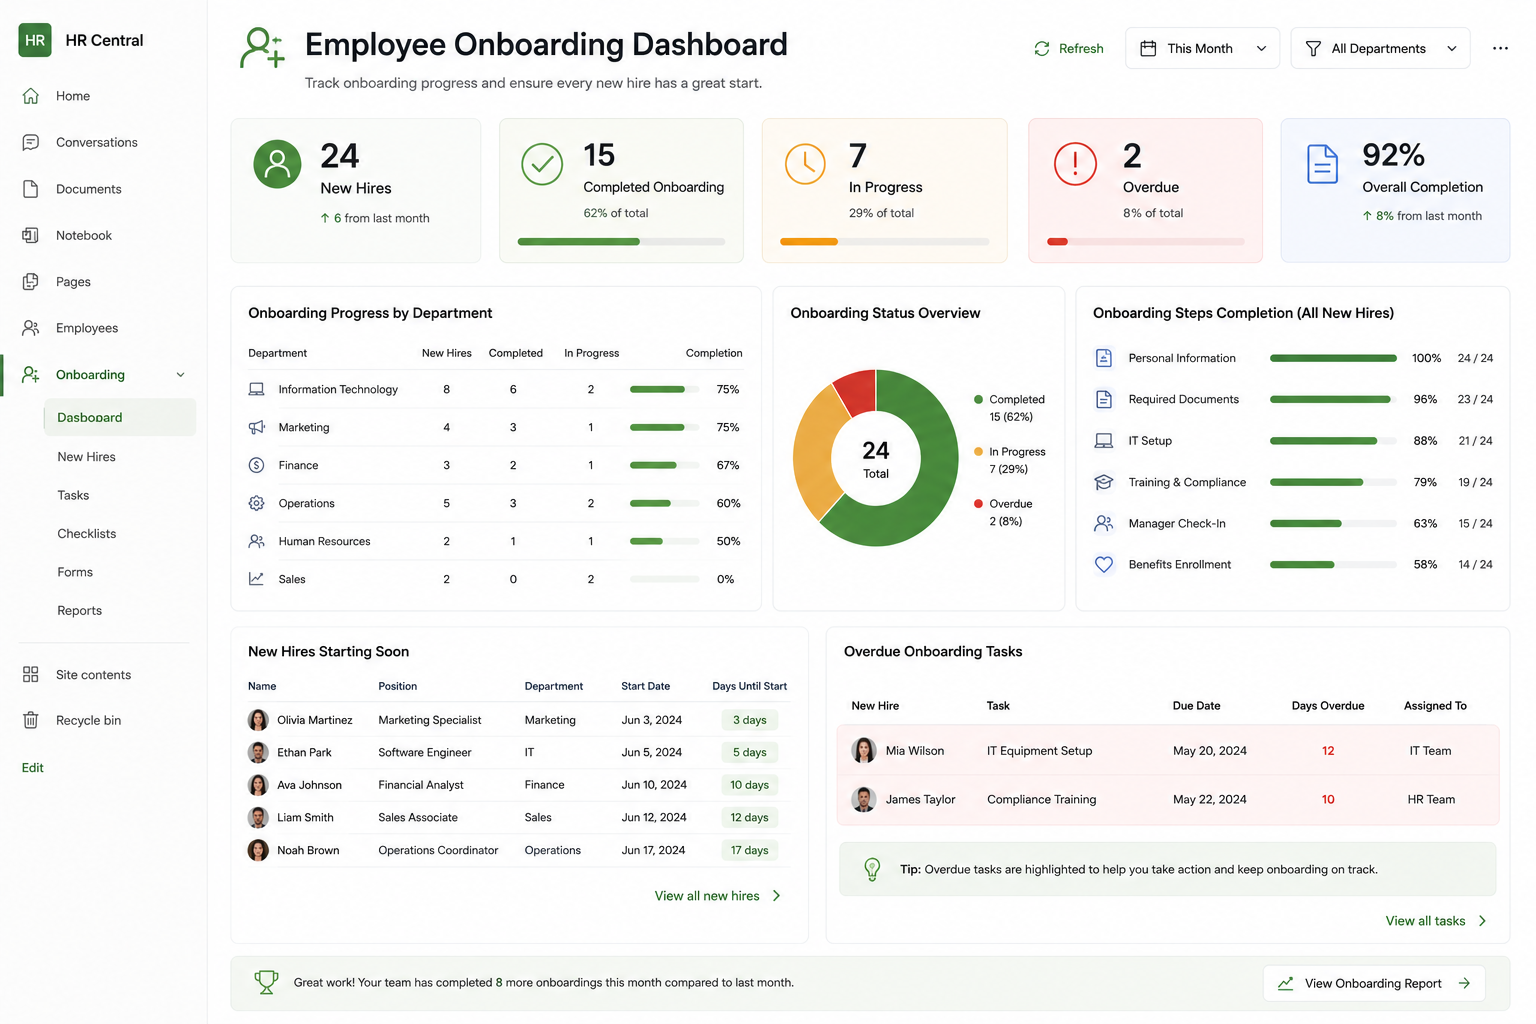
5. Employee Onboarding Dashboard
Give HR and department managers complete visibility into the onboarding process. Track pending tasks, completed activities, equipment requests, required training, document collection, and overall onboarding progress for every new employee.
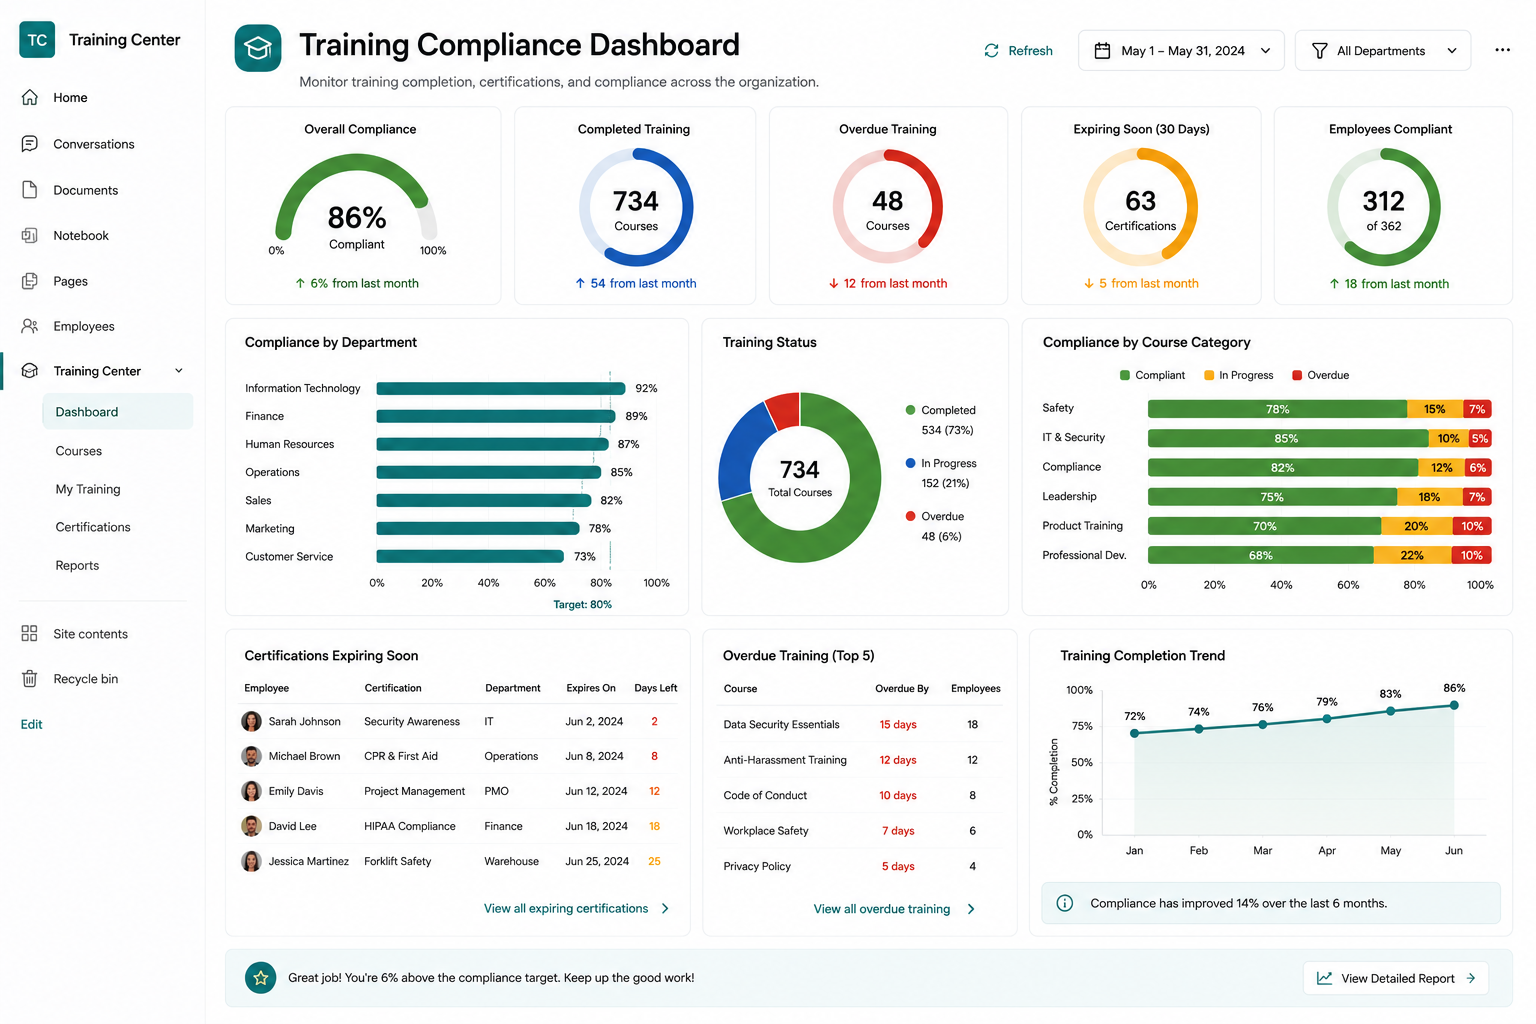
6. Training Compliance Dashboard
Monitor employee certifications and required training from a single location. Display completion percentages, overdue courses, department compliance rates, upcoming expirations, and certification progress using visual indicators and charts.
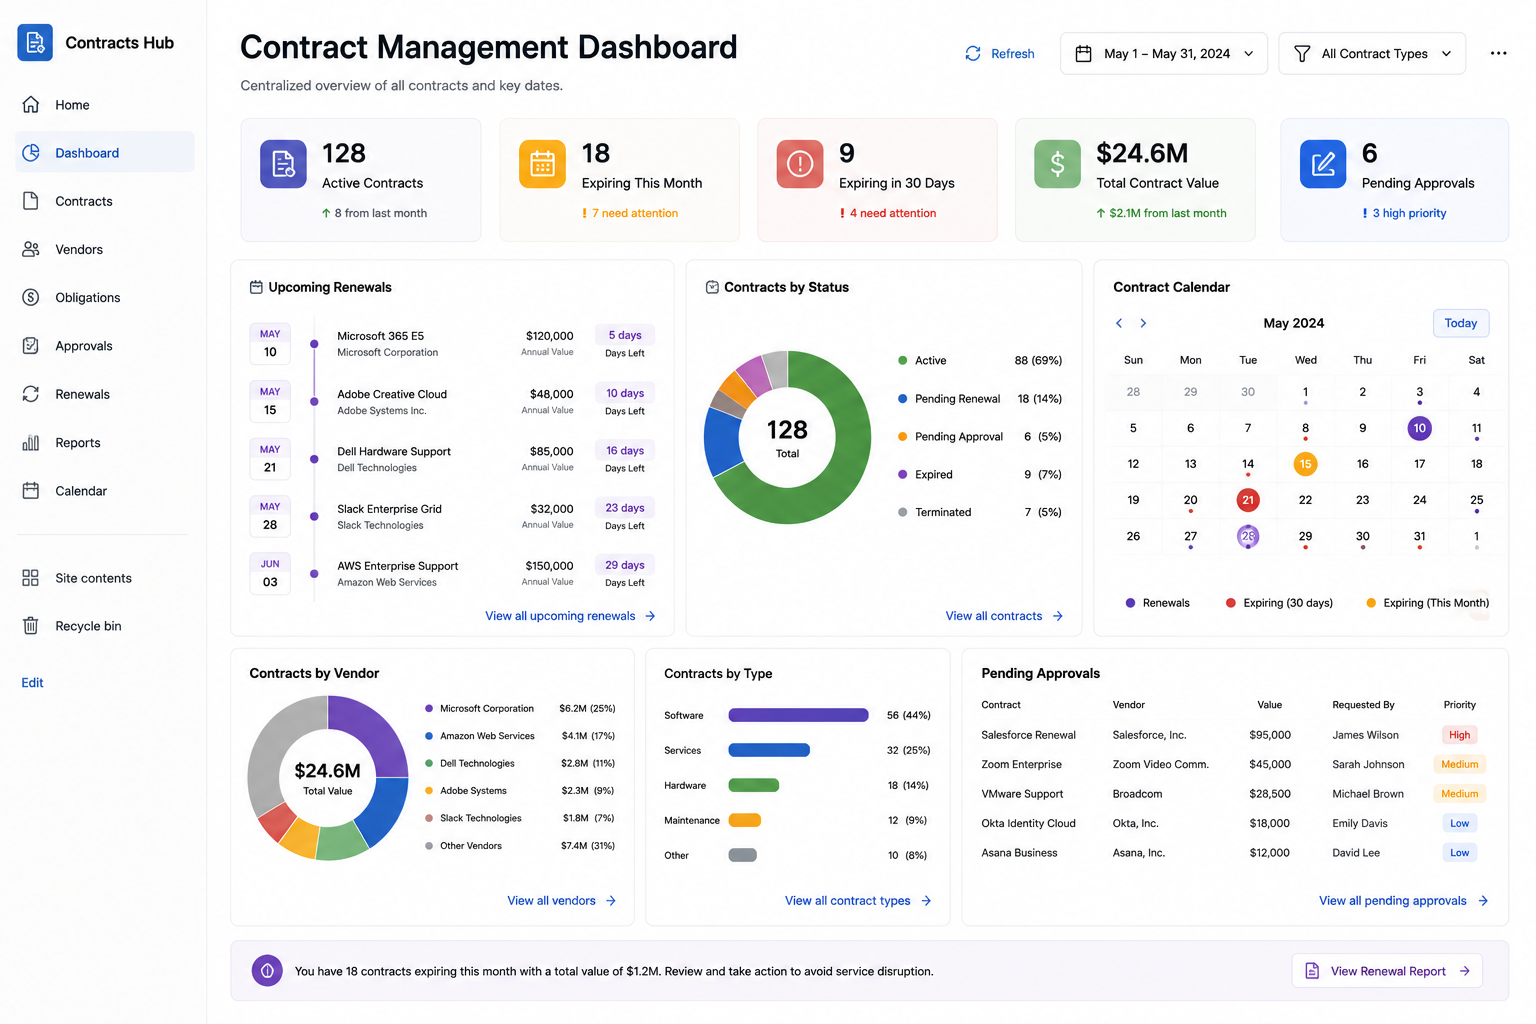
7. Contract Management Dashboard
Track contracts throughout their lifecycle. Display contracts nearing expiration, renewal status, approval progress, vendor summaries, contract values, and upcoming milestones so important dates never go unnoticed.
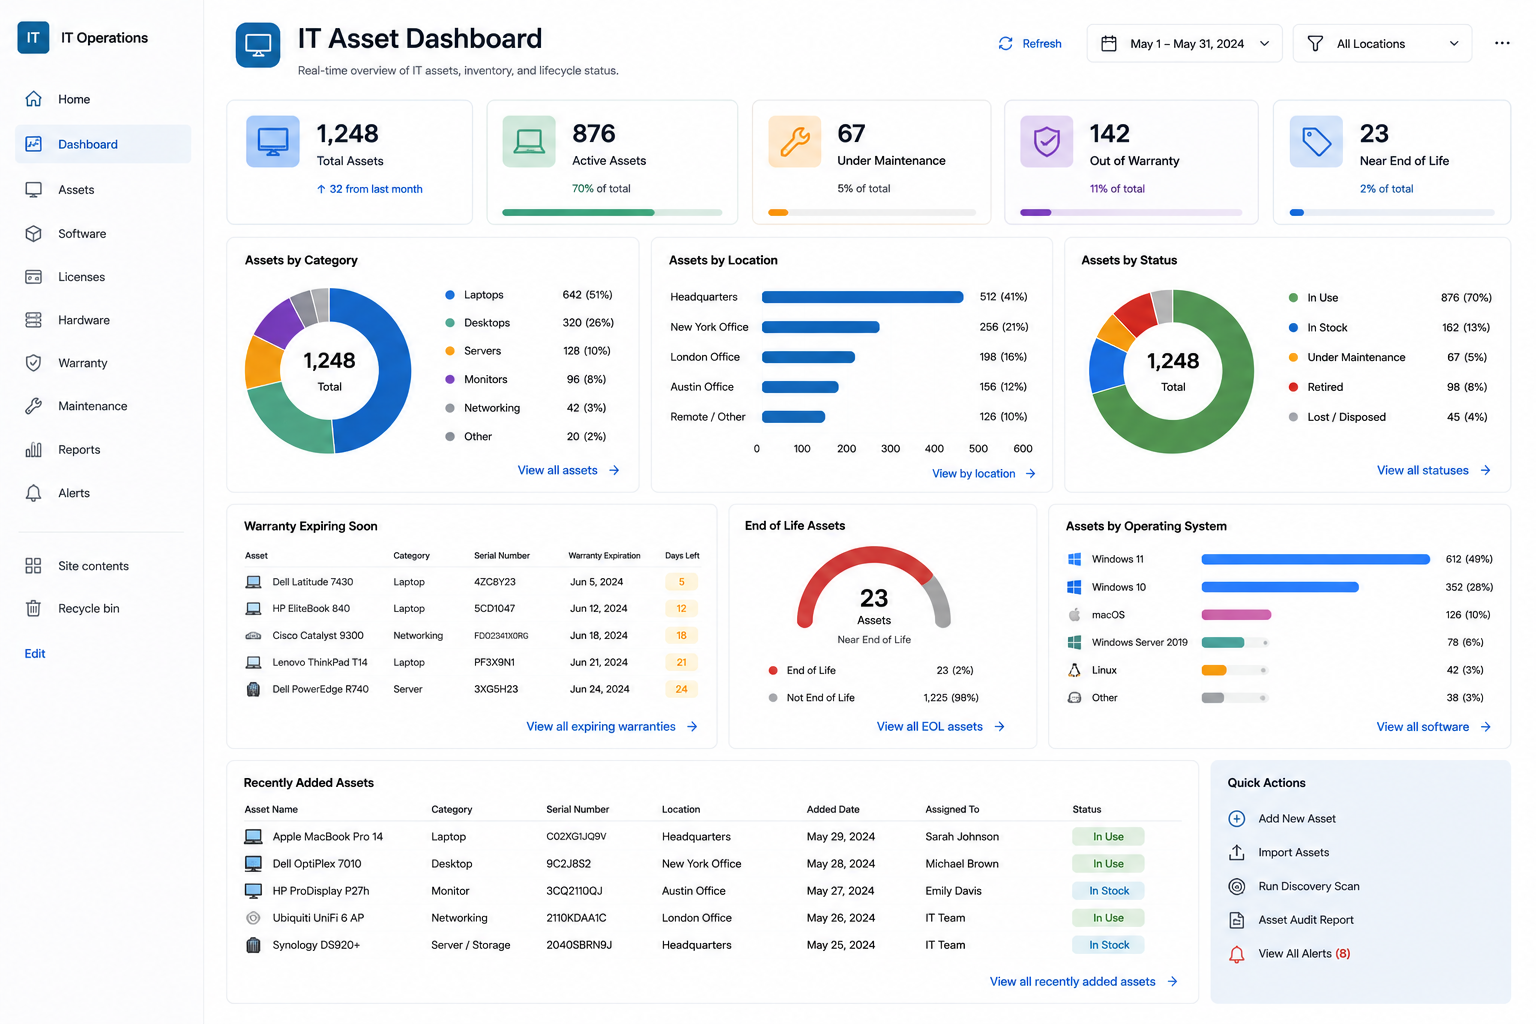
8. IT Asset Dashboard
Manage hardware and software assets more effectively by visualizing inventory levels, warranty expirations, software licensing, equipment assignments, replacement schedules, and support requests across the organization.
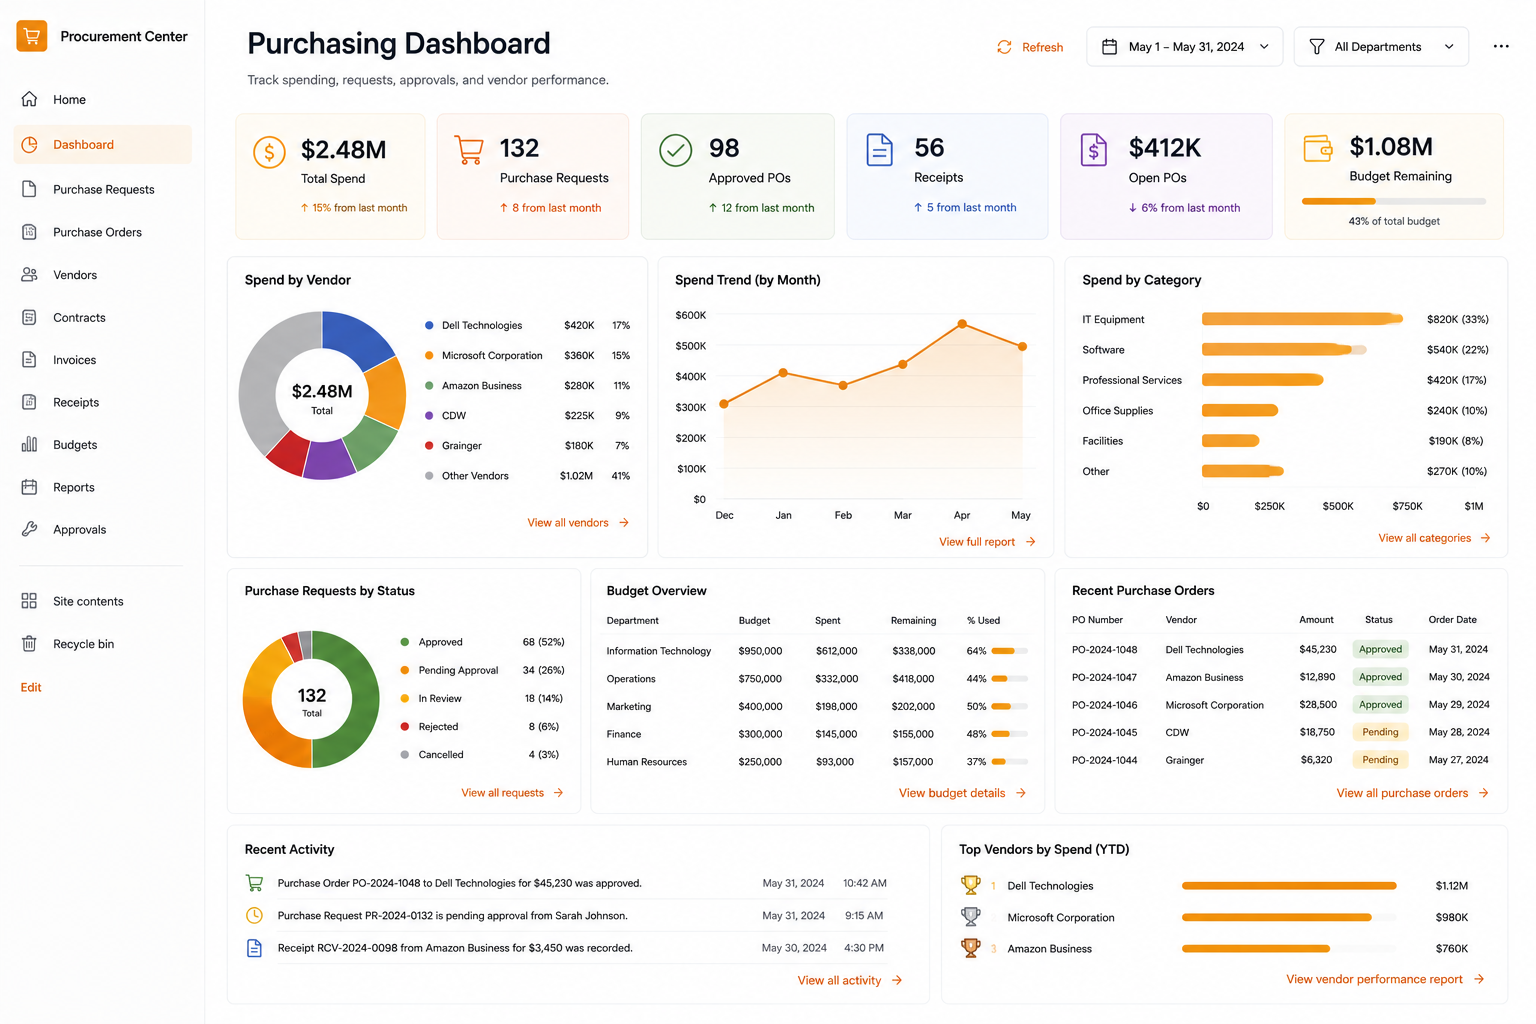
9. Purchasing Dashboard
Provide purchasing teams with visibility into procurement activities. Monitor purchase requests, approval bottlenecks, vendor spending, outstanding orders, monthly purchasing trends, and budget utilization through interactive dashboard components.
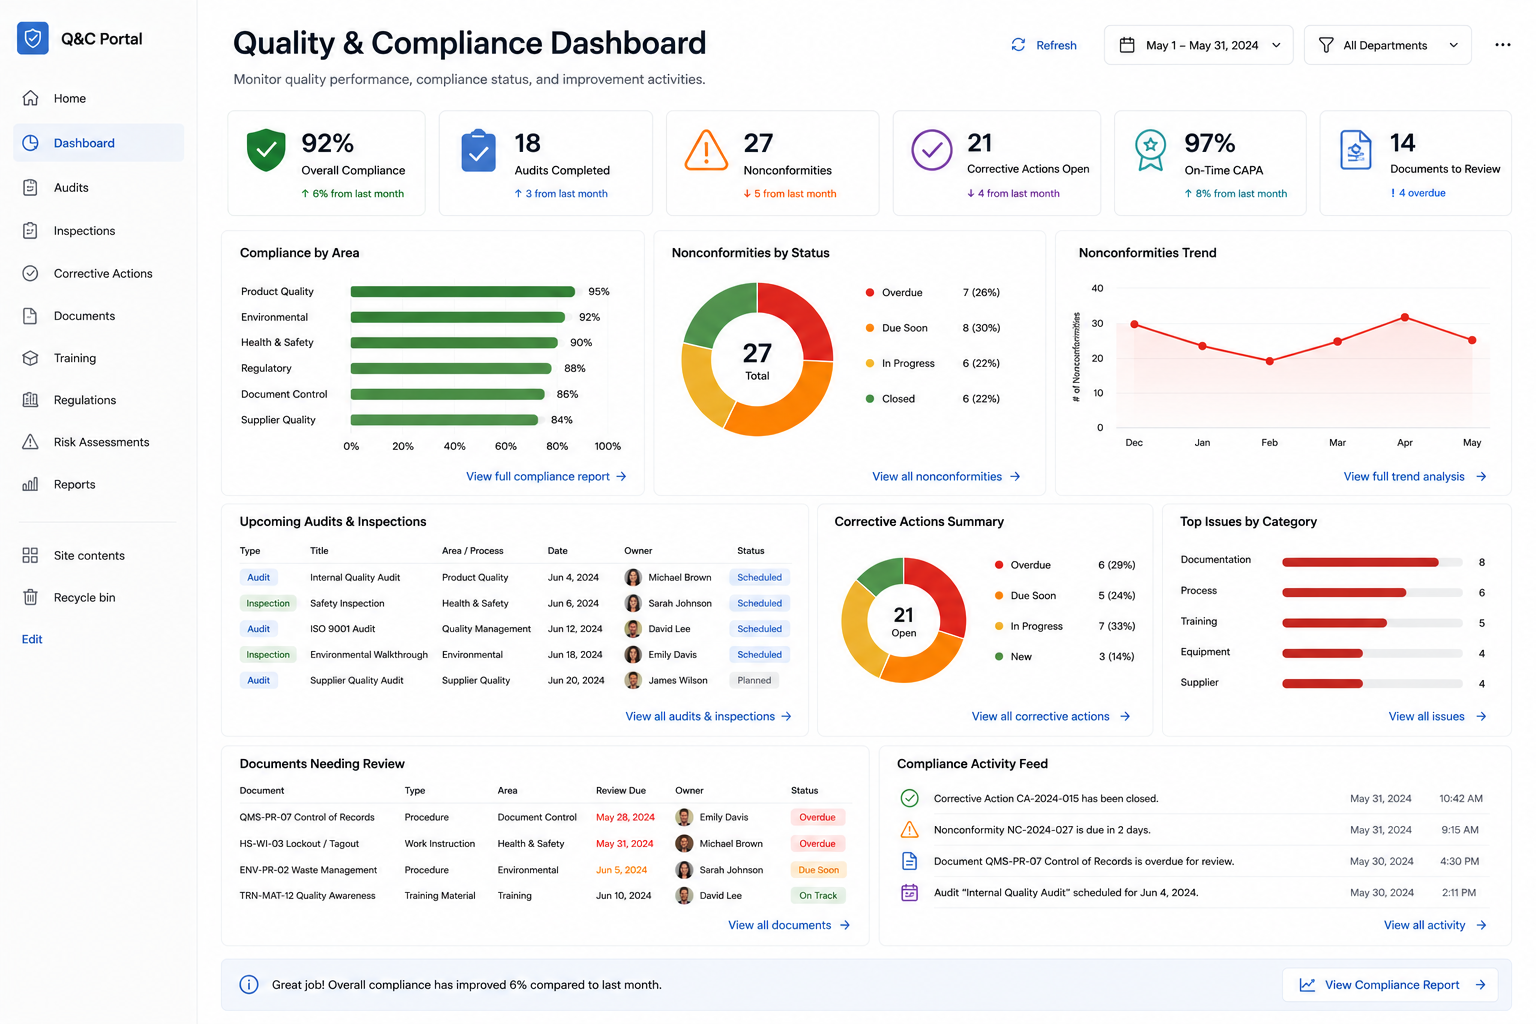
10. Quality & Compliance Dashboard
Track inspections, audits, corrective actions, policy acknowledgements, and compliance metrics from a single dashboard. Visual indicators help identify areas requiring immediate attention while providing management with a high-level compliance overview.
Build Dashboards Where Your Data Already Lives
Not every reporting solution requires enterprise business intelligence software. In many organizations, the information employees need is already stored inside SharePoint lists. The challenge is presenting that information in a way that's easy to understand at a glance.
Infowise Ultimate Forms makes it possible to build rich, interactive dashboards directly within SharePoint using no-code components including KPI counters, pie charts, bar charts, line charts, gauges, progress indicators, filters, and rollup summaries. Because the dashboards are built where your data already resides, users can quickly move from high-level metrics to the underlying list items without switching applications.
Whether you're tracking projects, sales, support requests, contracts, onboarding, or virtually any other business process, Ultimate Forms provides the tools to transform SharePoint data into meaningful dashboards that keep your organization informed and productive all without the complexity of Power BI.