
Introducing Our Newest Web Part
Every organization needs better ways to visualize and monitor data. Whether you want to track tasks, display totals, or highlight key performance figures, having instantly visible insights helps teams make informed decisions. Today we are excited to introduce the Counters web part for Ultimate Forms, a new visual component that brings dynamic, data-driven counters to your SharePoint pages.
The Counters web part is designed for simplicity and power. It allows you to display calculated values such as counts, sums, averages, minimums, and maximums based on any SharePoint list. It integrates seamlessly with the Ultimate Forms ecosystem and works with your existing data and dashboards. This article explains how the Counters web part works, how it fits into Ultimate Forms, and how businesses can use it to turn raw data into meaningful insights.
What Is the Counters Web Part?
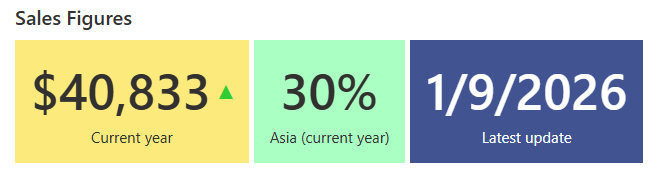
The Counters web part is a visual component that displays numeric (or date) values calculated from list data. You configure it to query a list and apply aggregation functions to one or more columns. The results are presented as stylish, easy-to-read counters on your SharePoint page.
Each counter connects to a specific column in a list and applies one of several operations:
-
Count – Shows how many items meet a given condition.
-
Sum – Adds all numeric values for the items in scope.
-
Average – Shows the mean value of a numeric column.
-
Minimum/Maximum – Displays the smallest or largest value.
You can also apply filters or conditions to the list query so that counters focus on specific subsets of data. For example, you can show only open tasks, sales for a particular region, or expense amounts above a threshold. The counters update dynamically, reflecting changes in the underlying data without manual refreshes.
As an added bonus, each counter can also be a link to open in the same or new tab. Provide the URL of the list view with the underlying data, so your users can easily dive right in for more details.
How Counters Fit into the Ultimate Forms Ecosystem
Ultimate Forms is a complete platform for no-code business solutions on SharePoint and Microsoft 365. It provides dynamic forms, powerful logic, process automation, advanced alerts, dashboards, and visualizations that help teams streamline workflows and improve productivity.
The Counters web part fits naturally into this ecosystem by extending how you present information from your lists. Like Charts, Rollups, and other web parts, Counters are configured through profiles that you set up in Ultimate Forms. Once configured, you can add them to SharePoint pages alongside other components. This means you can build a data-rich dashboard that combines dynamic counters with charts, forms, and lists.
For example, you might present:
-
Total number of support tickets open this month
-
Sum of all approved purchase orders in a year
-
Average resolution time for cases
-
Highest sales value recorded this quarter
Counters provide context and visibility at a glance. They enhance decision-making and reduce the time teams spend hunting for numbers scattered across lists and reports.
Key Benefits of the Counters Web Part
1. Ease of Use
One of the main advantages of Counters is how easy it is to set up. You don’t need to write code, create custom views, or use external reporting tools. Configuration is done through the Ultimate Forms web part interface:
-
Select the list to query
-
Define the counter operation
-
(Optional) Add filters or conditions
-
Add the configured counter to your page
This simplicity makes Counters accessible to business users who understand their data but do not have technical expertise in development or database queries.
2. Dynamic and Real Time
Counters are not static. Because they query the list directly, the numbers reflect the most current state of the data. If a user updates an item, adds a new item, or changes a status, the counters update automatically. This gives teams confidence that the numbers they see on dashboards represent live business conditions.
3. Flexible Filtering and Conditions
Counters can be configured to include filters and conditions so that results focus on specific subsets of items. You might filter based on:
-
List views
-
Column values (e.g., status equals “Open”)
-
Date ranges
-
Assigned user
- Connect to Infowise Filter web part on the same page for dynamic filtering and drilldowns
Applying conditions gives you greater control over what the counter displays. You can build multiple counters using different filters and show them side by side for comparison.
4. Trend Indicators
Counters can show trend arrows indicating whether a value has increased or decreased compared to a previous period or value. This helps users quickly interpret whether performance is improving or declining, without adding extra elements or calculations.
5. Percentage Displays
In many scenarios, showing a percentage is more meaningful than raw numbers. Counters support percentage displays by configuring a total value. The specific value is divided by the total and displayed as a percentage. For example, showing the percentage of sales from a specific region compared to total sales gives better insight into performance distribution.
Real-World Scenarios
The true power of the Counters web part becomes clear when applied to specific business scenarios. Below are practical examples where Counters can improve workflow visibility and decision-making.
Scenario 1: Support Team Ticket Dashboard
A support team tracks tickets in a SharePoint list. Each ticket has a status, priority, and assigned agent. With Counters, the team can show:
-
Number of open tickets – Count of tickets where Status = Open
-
High-priority tickets – Count where Priority = High
-
Average response time – Average of a numeric column tracking response hours
-
Maximum days unresolved – Highest value in the days unresolved column
These counters give managers and agents instant insight into workload, bottlenecks, and performance. Agents can prioritize their actions based on real data displayed at the top of a dashboard page.
Scenario 2: Sales Dashboard for Regional Performance
A sales operations team uses a SharePoint list to store sales records. Each record includes a region, amount, product category, and date. With Counters, they can display:
-
Total sales this quarter – Sum of all sales amounts
-
Sales in Europe – Sum filtered by Region = Europe
-
Average deal size – Average sale amount
-
Largest single sale – Maximum sale amount
Adding trend indicators could show whether these numbers are increasing or decreasing compared to last quarter. This provides leadership with up-to-date views of performance without exporting to Excel or Power BI.
Scenario 3: Procurement and Expense Tracking
A procurement team manages purchase orders and expenses through SharePoint. Each record includes a total cost, vendor, date, and status. With Counters, a dashboard can show:
-
Total spend this month – Sum of costs for items created this month
-
Count of pending approvals – Count where status = Pending
-
Average vendor cost – Average of cost per vendor
-
Highest vendor spend – Maximum expense value
This allows finance teams and leadership to spot overspending early and address procurement bottlenecks quickly.
Scenario 4: Project Management Metrics
Project managers often need to monitor key metrics across multiple projects. With a SharePoint list tracking tasks or milestones, Counters can show:
-
Total tasks remaining – Count where Status != Completed
-
Completed tasks – Count where Status = Completed
-
Average task duration – Average of duration field
-
Longest delay – Maximum days late
This perspective helps project managers identify risks and allocate resources more effectively.
Making Dashboards Better with Counters
Counters do not exist in isolation. They work best when combined with other Ultimate Forms components such as charts, rollups, and list views. A dashboard can include multiple counters at the top, followed by charts that show visual trends, and lists that show detailed records. With this layout, business users get both high-level insight and granular data in one place.
Ultimate Forms supports rich customization, so you can align the look and feel of your dashboards with your organization’s branding and workflow styles. Add colors, icons, sections, or conditions to make information more digestible.
Getting Started with Counters
Setting up the Counters web part requires only a few steps:
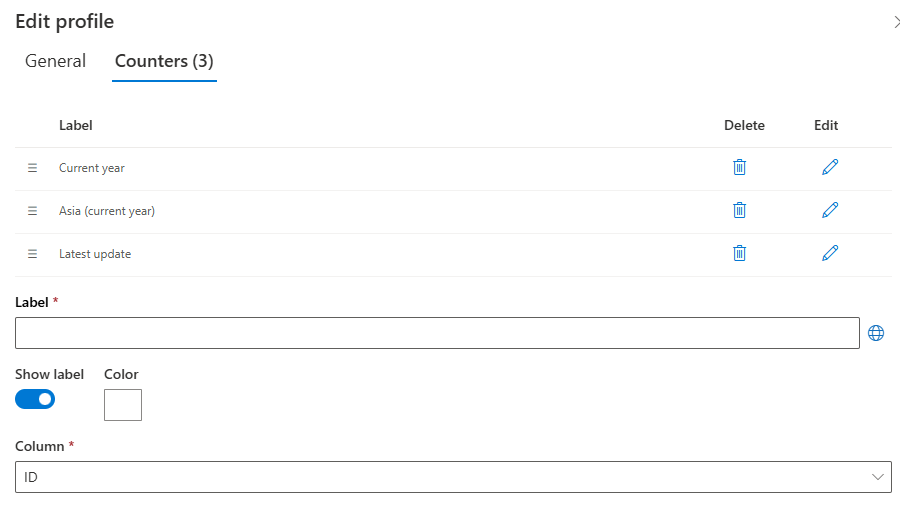
-
Create a new counter profile in the Ultimate Forms administration interface.
-
Specify the list you want to query.
- Add one or more counters
- Select the column to summarize
-
Select the operation (Count, Sum, Average, Min, Max).
-
Add any filters or conditions to narrow the query.
-
Add the Infowise Form web part to your SharePoint page, switch to Counter mode and select the profiles you created.
With that done, your counters will display live metrics from your list. It is that straightforward.
Conclusion
The new Counters web part adds powerful, real-time metrics to your Ultimate Forms dashboards. It is easy to set up, flexible, and integrates seamlessly with your SharePoint lists. Whether you need to show counts, sums, averages, minimums, or maximums, Counters give you a dynamic way to highlight key numbers without external tools.
Counters help teams spend less time gathering reports and more time acting on insights. From support dashboards and sales summaries to project tracking and expense monitoring, this web part brings clarity to data that matters. As part of the Ultimate Forms platform, Counters extend your SharePoint solutions with actionable visual metrics that decision makers will rely on every day.
If you are building business dashboards and want deeper visibility into your list data, the Counters web part is a powerful new tool worth exploring. With just a few clicks, you can turn raw list data into meaningful metrics that drive better outcomes.