Introduction
Associated Items column is the cornerstone of any business application in Ultimate Forms. It allows creating relationships between lists to mimic the relationships in the real world.
The component makes it easy to set up single-to-multiple and multiple-to-multiple connections in any form. A common example would be line items in an invoice or tasks in a project. Being one of the central components, it offers a wide variety of features and the list just keeps growing.
Charts in Forms
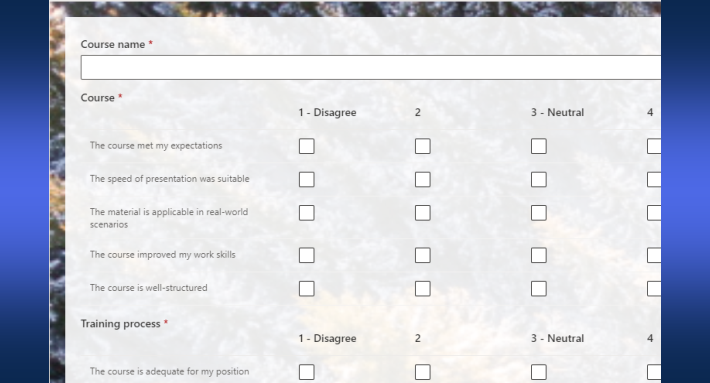
Today I would like to focus one powerful yet not a well-known feature of the column. I'm referring to the ability to display associated items as a chart. This makes it easy to analyze the current status of associated items at a glance. I am going to demonstrate this with an example:
I am managing a list of projects, where each project contains multiple tasks. I want to show a pie chart that displays percentage of tasks by status, all within the corresponding parent project.
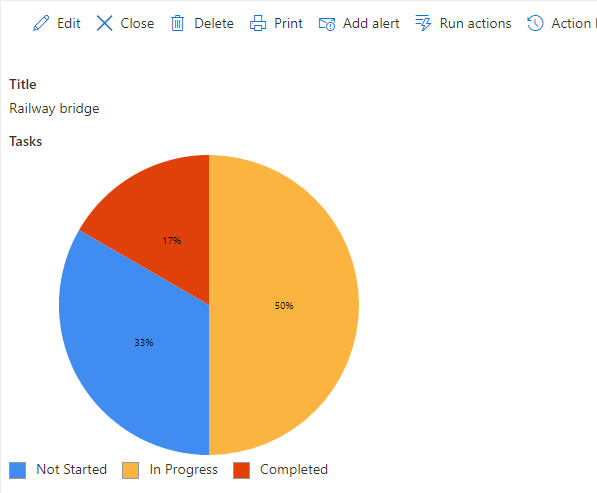
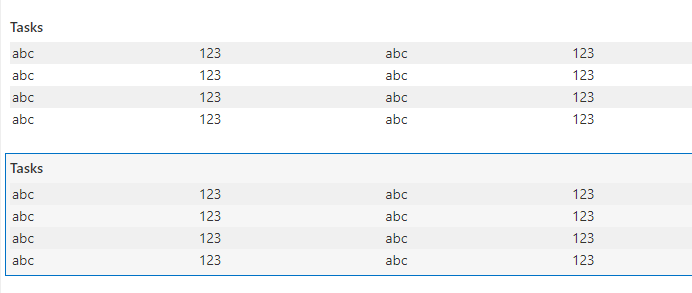
This is how my Display form is going to look. But when I enter the Edit form, I will be showing the regular task grid, with the ability to add and manage tasks.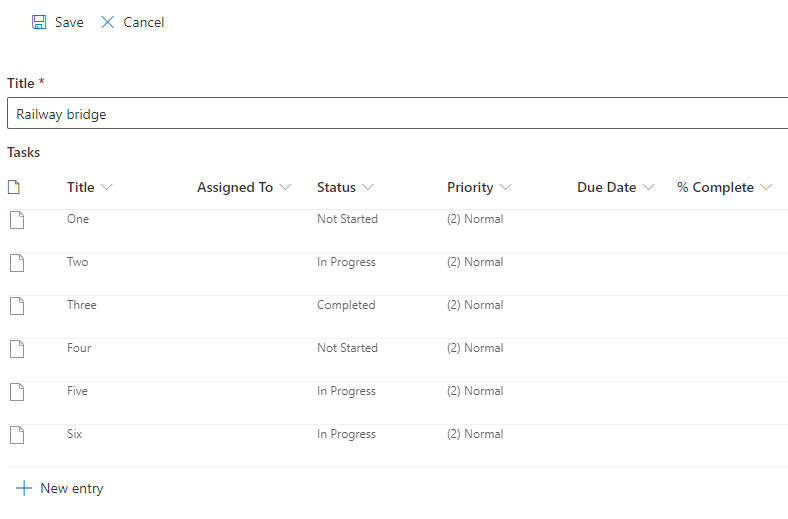
Step-by-Step Instructions
I invite you to follow these simple instructions to try out this solution in your own list.
Create a List
- First, we create a list of Projects. I'm using a simple list, I didn't even add any additional column, beyond the built-in Title column.
- Open Ultimate Forms from the list by clicking on Design button on the toolbar.
- Next click on Form Designer to start creating our Modern form. Choose to generate the form automatically, it's the easiest way.
Create Associated Items Column
- Under Columns in the left pane, click on New Column and choose Associated Items as column type
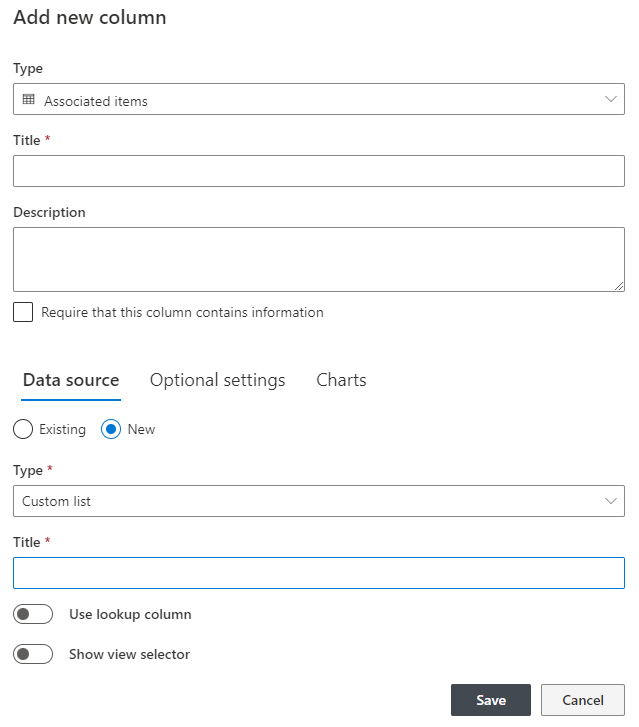
- Under Date Source click on New to create a new child list, then select Tasks under Type to use Tasks list template. Enter a title for the list (I'm using Tasks for both column and list titles here).
- Save the column settings, it will now appear under Columns.
Chart Configuration
- Click on the gear icon next to the name of the column to edit its settings. We need to do it again, because when we first defined it, Tasks list didn't exist yet. Next switch to Charts tab.
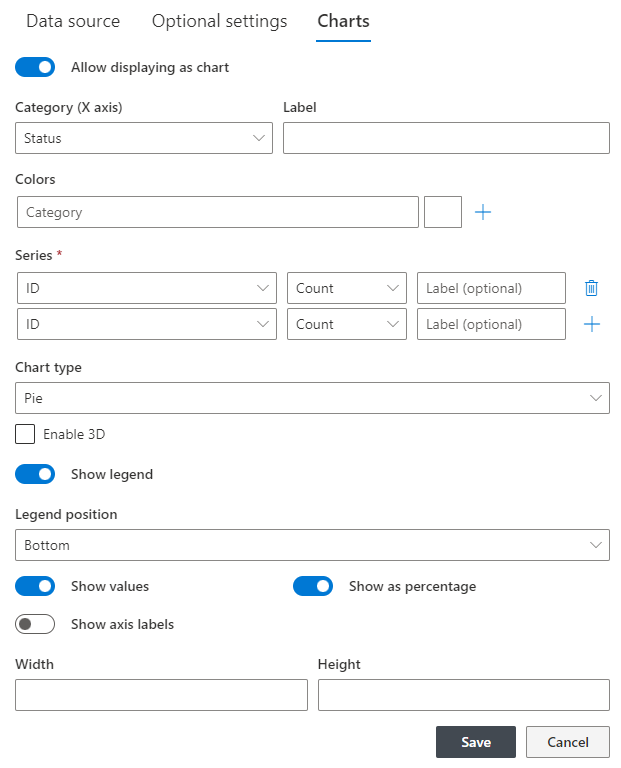
- Toggle Allow displaying as chart. This will reveal chart settings.
- Select Status as our X axis column. The chart will group the values according to this column.
- Add at least one series, in our case we will count items by ID.
- Select Pie as chart type, toggle the Show legend setting.
- Toggle Show values and then toggle Show as percentage.
- Save the column settings.
- In the left pane click on the lock icon next to Columns section title. This unlocks the ability to place the same column more than once on the design surface of the form. We need that to show once as chart for the Display form and the regular grid for New and Edit forms.
- Drag our Tasks column to the form twice.
- Click on the first one and select Display as chart.

- Note that the form won't display the column as a chart unless we active this option. It makes no difference if we configured the chart settings or not. It allows us to place multiple instances of the column on the form. You can then set them to be in different modes and display or hide them using different permissions.
Permission Rules
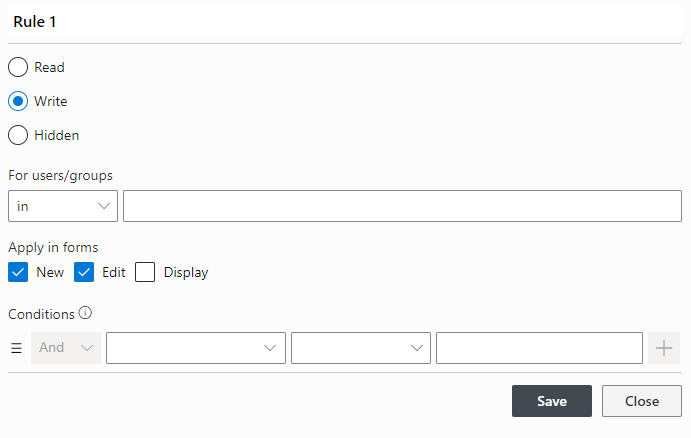
- Add a permissions rule for the chart version of the column to only show it in Display form
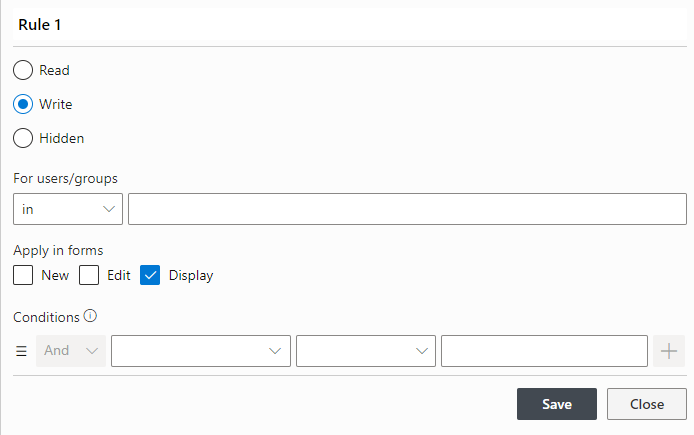
- Note that we do not need to add a corresponding Hidden rule. The form will implicitly hide it when the Write rule doesn't apply.
- Do the same for the second instance, choosing New and Edit forms
- Publish the form and that's it! Now it will display as chart when read-only and editable in grid otherwise.
Conclusion
Associated Items column makes it easy to show and manage associated items in SharePoint forms. You use it to implement repeating child items section within the parent form.
With the Chart option of Associated Items in modern forms, you can display the child items as a chart. This helps you visualize the data for users.
Add your comment