
Part 1: Creating a proof of concept for Charts using Infowise Ultimate Forms
It is nice to see how SharePoint has changed over the years. Modern design has taken over Classical design, making it more user-friendly.
This week I started working with something very new. I am planning to create a bank deposits dashboard to check how the deposits have changed over the years.
Planning the Bank Branch Deposit Dashboard
A bank branch deposit dashboard defines how the deposits across various bank branches have changed over time. To complete the dashboard, I needed four charts.
- The first chart shows a summary of the total and increases in deposit throughout three years.
- The second chart shows the changes in bank branch deposits over the years based on the country.
- The third chart shows the changes in bank branch deposits over the years based on the city.
- The fourth chart to define the trend over the years, based on the various filters.
To begin, I created a design I wanted to use.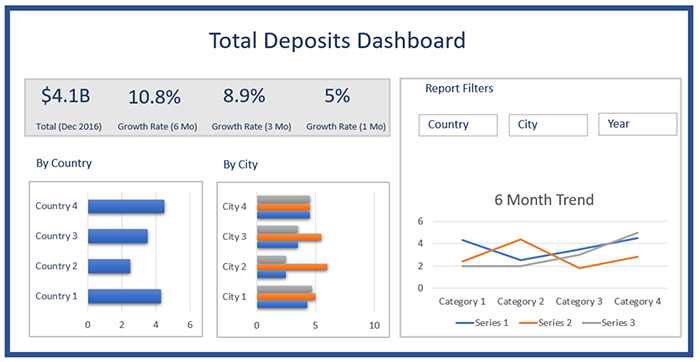
I started with a simple design of bar graphs, stacked bar graphs, and a Filter based graph.
Once I defined the design, I started to think about what will be the best way to create a dashboard. I wanted to create a Modern page and add the charts. I also wanted to use SharePoint Design principals of using layouts and columns to ensure a responsive design, which looks the same on any device a person uses.
Creating a Proof of Concept (POC) for a Bank Branch Deposit Dashboard
To begin with, I started by evaluating and eliminating options to create a quick and easy solution for my Bank Branch Deposit dashboard.
Using Quick Charts in SharePoint Modern Pages
One of the simplest options to create a chart is to use the quick charts web-part in a Modern Page. It is effortless to add quick charts web-part, and it offers an option of Bar Chart and Pie Chart. It gave me an option to connect it to a List or to add values manually. However, you can only add 12 values manually.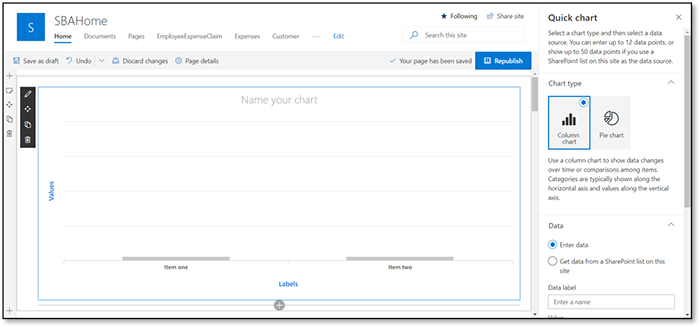
Though it's a quick option, it is not enough for my dashboard. I needed a bar chart and the line chart, which is not available.
Using Power BI Dashboards and integrating with SharePoint
Power BI would have been a very neat solution. However, I didn't have a license. I wanted to use something simple, quick, and less costly.
Using SharePoint Framework (SPFx) with Custom Javascript-based Charts
Another option to have a custom chart solution is to create a quick SharePoint Framework based web-part for modern pages. We can then use the REST API of SharePoint Lists to fetch the data and connect it with a javascript chart library.
There are hundreds of javascript chart libraries available. I have used High Charts before, and it is straightforward to integrate.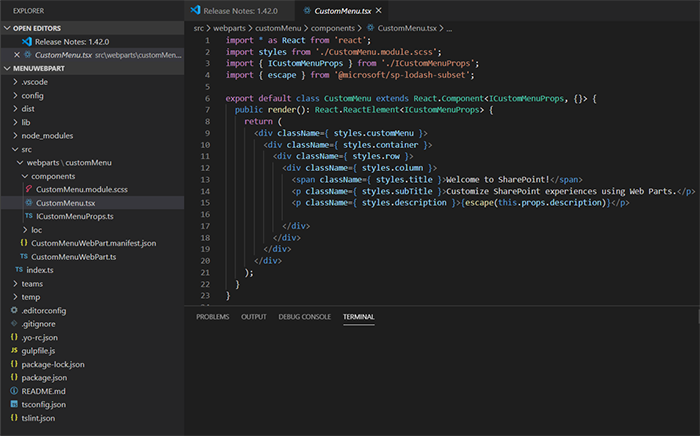
However, this would mean we would need some hours for coding. Even updating the web-part, in case there are changes later would also need more staff-hours. I kept it as an option, but I wanted to find out other alternatives. My requirements were quick, simple graphs, with options to customize quickly and free or include in some other license. I then started exploring the chart options in Infowise Ultimate Forms.
Using Infowise Ultimate Forms Chart Web Part
I was already using Infowise Ultimate Forms to create my end to end business processes. I just finished working on a Personal Loan application system. You can read about it here. I started by exploring the charts option for Infowise Ultimate Forms. The best part is I could use the same User Interface.
You can easily find everything at the same place while Infowise Ultimate forms. This feature is impressive because my Business Users are already comfortable using Infowise Ultimate Forms. If the charts are easy to use, like the forms, processes, and workflows, my end users can customize their dashboard.
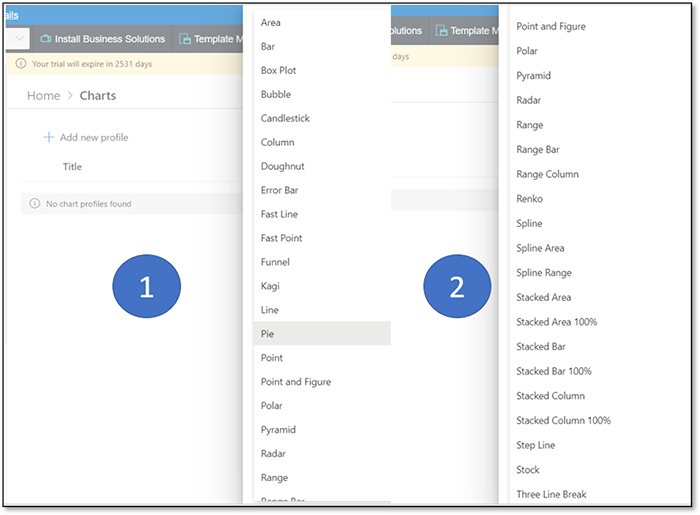
Innumerable options for chart types
The first thing that impressed me was a large number of options for Chart Types. Check out the options below. These many options make life easy.
Creating a Bar Chart using Infowise Ultimate Forms Charts
Since I was still exploring, I started by choosing the Stacked Bar Graph as an option for my POC. It has loads of options to define the display of the chart. It also has an option to choose if I want it to be 3D or not. All with a click of a button.
Creating a Profile for adding Bar Chart using Infowise Ultimate Forms Charts
My first requirement to create a chart is to create a profile. A profile defines the configurations of any chart. We can then add the chart to any number of pages, and updating the profile will also update the charts in all the pages, making updating a breeze.
To create a profile, go to charts and then add a new profile. Lists of all profiles created before are also listed here. This profile makes it easy to create multiple profiles from the same data to create a variety of charts.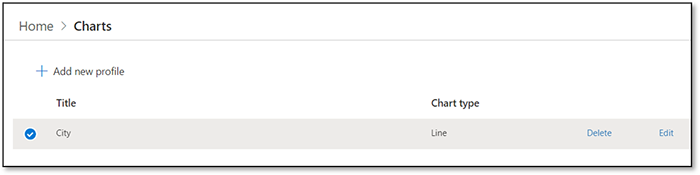
As soon as you create a new profile, you get a large number of options for configuration.
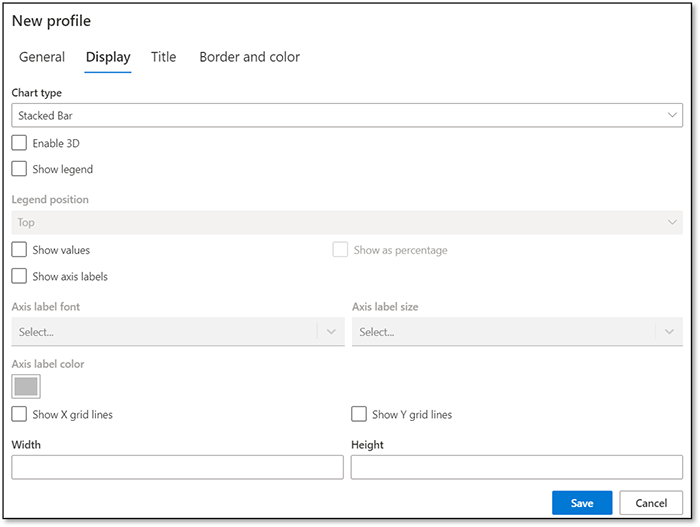
Few interesting configuration options include:
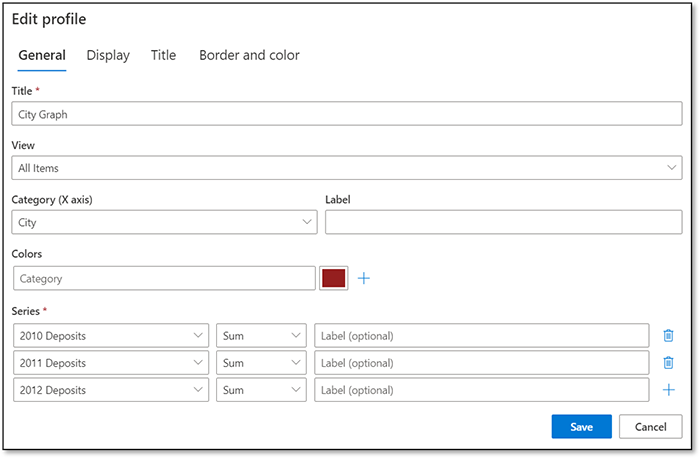
- You can use the view for any list as a base for the data. For example, I can create a view which only displays Bank Branches in some predefined cities. Then my graph will only show the data related to the predefined cities.
- You can create a series where the value on the y-axis is the sum of values. Like in the chart below, I can sum the deposits to be displayed for each year.
- You can also update the size, color and dimension, making it easy to create fantastic looking graphs.
Adding a chart to the Home Page, using Infowise Chart Web part
Once we create the profile, it is effortless to add a chart to any page using Infowise Chart Web-part. The web-part comes with a drop-down option to select the profile. You can add multiple charts to your page and create different graphs by linking them to different profiles.
If there is any change in the profile, the graph adapts automatically without any additional effort.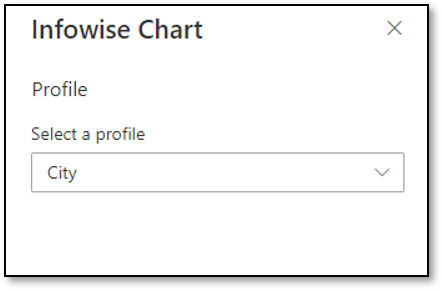
Final POC using Infowise Ultimate Forms Chart Web part
Once we select the profile, the graph is automatically populated. This process helps me to create quick graphs with many customizations. It is cost-effective. Also, I am sure I can easily train my end-users to create graphs on their own.