
Introduction
Data is one of your organization’s most valuable assets. But without proper visualization, it’s just numbers and text sitting in SharePoint lists. Spreadsheets and static reports make it difficult to spot patterns, track progress, or communicate results effectively. That’s where Ultimate Forms Charts come in.
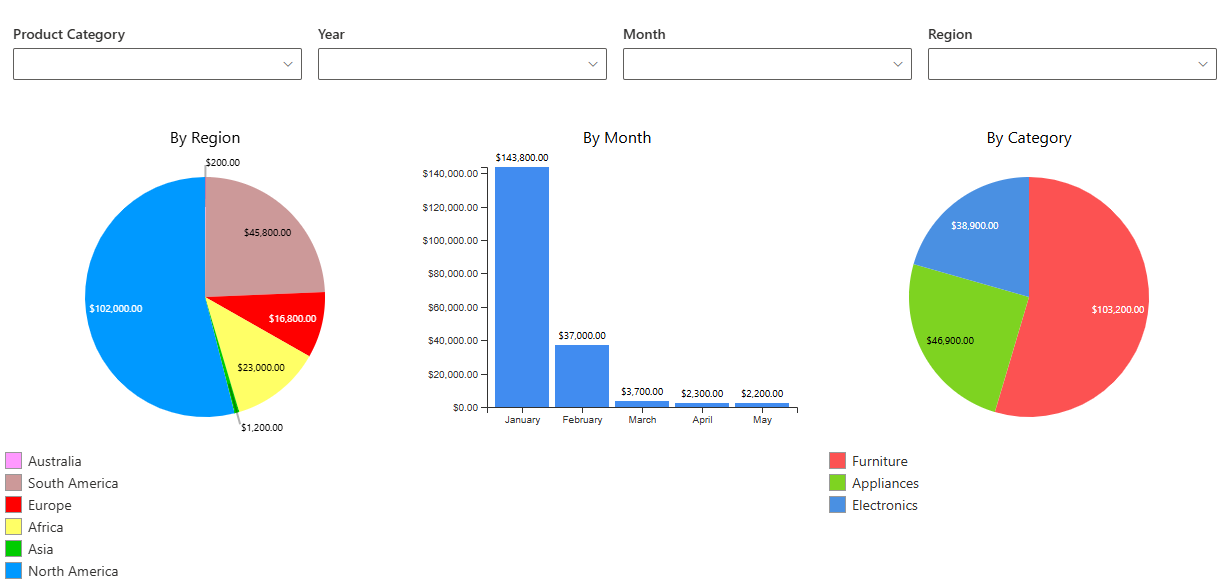
With Infowise Ultimate Forms, you can transform your SharePoint data into clear, dynamic visualizations. Be it bar charts, pie charts, line graphs, and more. All all without leaving your Microsoft 365 environment or writing a single line of code. It’s an intuitive, no-code solution for anyone who wants to turn information into actionable insights.
Why Data Visualization Matters
1. Make information easy to understand
Raw tables and lists force users to scan through hundreds of rows just to find meaning. Charts help summarize large amounts of data in seconds, revealing key takeaways at a glance.
2. Enable faster decisions
Visual data lets users see trends, outliers, and bottlenecks instantly. Instead of waiting for reports, managers can identify what’s working and what needs attention in real time.
3. Build a data-driven culture
When you embed charts directly inside SharePoint, insights become part of everyone’s workflow. Users no longer need to rely on IT or external BI tools. They can see the metrics that matter, right where they work every day.
4. Increase trust and transparency
Visual dashboards make performance metrics visible to everyone, creating accountability and promoting data-driven discussions across departments.
Ultimate Forms Charts: Built for SharePoint
Ultimate Forms includes a built-in charting component that allows you to visualize list and library data in SharePoint without exporting to Excel or relying on third-party integrations.
Key capabilities include:
-
Multiple chart types: Bar, column, line, pie, area, and donut charts. Perfect for comparing performance, tracking time trends, or showing proportions.
-
Dynamic data sources: Charts automatically refresh as list data changes.
-
Interactive embedding: Display charts inside SharePoint pages, dashboards, or even directly within list forms.
-
Simple configuration: Choose a list, select the chart type, pick your data columns, and you’re done.
-
Fully integrated: No need for Power BI or external services—the charts work natively inside SharePoint with Ultimate Forms.
You can design a visual experience that fits your team’s goals, branding, and reporting needs. All without any coding or scripting.
Real-World Scenarios
1. Sales Performance Dashboard
Your sales team tracks deals in a SharePoint list with columns for amount, stage, and rep.
With Ultimate Forms Charts, you can:
-
Show total sales per salesperson in a bar chart
-
Display sales progress over time in a line chart
-
Visualize deal distribution by stage in a pie chart
This dashboard gives managers instant insight into sales performance, pipeline health, and forecasted revenue—all without exporting data.
2. Service Desk Metrics
Your support team logs incidents in SharePoint. With charts, you can:
-
Track open tickets by category in a column chart
-
Measure resolution time trends using a line chart
-
Show SLA compliance rate in a donut chart
These visuals help teams quickly identify workload distribution, service bottlenecks, and compliance performance—making it easy to take corrective action.
3. Project Management Dashboard
Your PMO tracks project status, budgets, and milestones in SharePoint lists.
Ultimate Forms Charts can display:
-
Active projects by department
-
Budget utilization per project
-
Task completion progress
With these dashboards embedded in SharePoint, project managers and stakeholders get a live view of execution and resource allocation—no manual reporting required.
Best Practices for SharePoint Data Visualization
-
Start with a question: Define what insight or decision your chart should support.
-
Choose the right chart type:
-
Bar/Column – Compare values across categories
-
Line – Show changes over time
-
Pie/Donut – Show proportions or parts of a whole
-
Area – Highlight cumulative totals or trends
-
-
Keep it simple: Focus on clarity—avoid clutter, 3D effects, and unnecessary colors.
-
Use clear labels and legends: Always identify data sources and units.
-
Embed in context: Place charts next to the related forms or lists, so users can view and act on insights without switching screens.
-
Ensure consistency: Use standard colors, fonts, and naming conventions across all dashboards for a professional look and feel.
Advantages of Ultimate Forms Charts
| Feature | Benefit |
|---|---|
| No-code setup | Create and configure charts directly in SharePoint without programming. |
| Native integration | Works seamlessly with SharePoint lists and Ultimate Forms solutions. |
| Real-time updates | Charts reflect live data—no manual refresh or re-import needed. |
| Unified platform | Capture, automate, and visualize data in one place—Microsoft 365. |
| Unlimited flexibility | Combine charts with forms, rules, and automation for complete business solutions. |
| Dynamic filters | Conbine with the included Filter web part to create dynamic dashboard in minutes |
Taking Data Visualization Further
Ultimate Forms Charts aren’t just standalone visuals—they can be part of broader business solutions:
-
Add conditional formatting to highlight KPIs that meet or miss targets.
-
Use Alerts to trigger automated notifications based on thresholds.
-
Combine charts with Document Generation to create summary reports automatically.
-
Integrate charts within custom dashboards for executives or department leads.
From operational metrics to strategic insights, Ultimate Forms empowers every team to build and maintain their own SharePoint analytics—without relying on external reporting tools.
Conclusion
Data visualization turns your SharePoint lists from static records into living, breathing business intelligence tools. With Ultimate Forms Charts, you don’t need Power BI, developers, or complex integrations. You can create professional dashboards right inside SharePoint.
Whether you’re tracking sales, managing projects, or monitoring support performance, Ultimate Forms helps you see what matters most, when it matters most. So you can take action with confidence.
Transform your data into insight. Build smarter dashboards with Ultimate Forms.