Every parent record has a bottom line hiding in its children. The invoice's total lives in its line items. The project's progress lives in its tasks. SharePoint, on its own, makes you compute these by hand, or in a spreadsheet on the side.
The Associated Items Summary column of Ultimate Forms computes them in place. It counts, sums, and averages related items automatically, stores the result on the parent record, and recalculates the moment any child changes. The bottom line becomes a column: always current, visible in views, and usable by every rule and workflow in the platform.
This guide covers the relationship underneath, the operations, the setup, and the business logic summaries unlock. For the dashboard kit they feed, see the ten dashboards guide.
First, the relationship
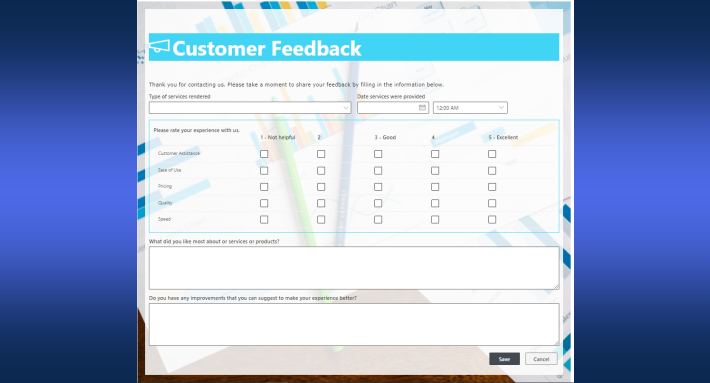
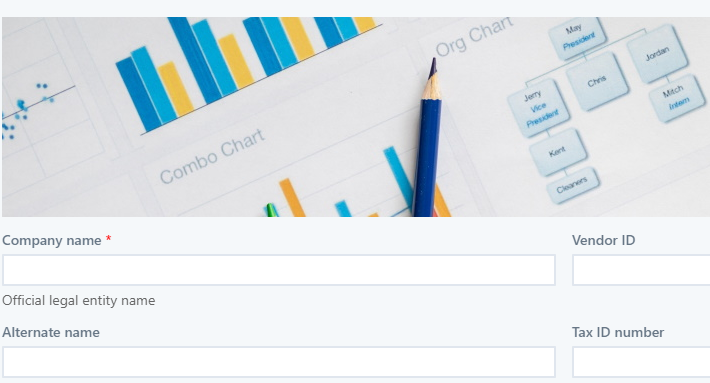
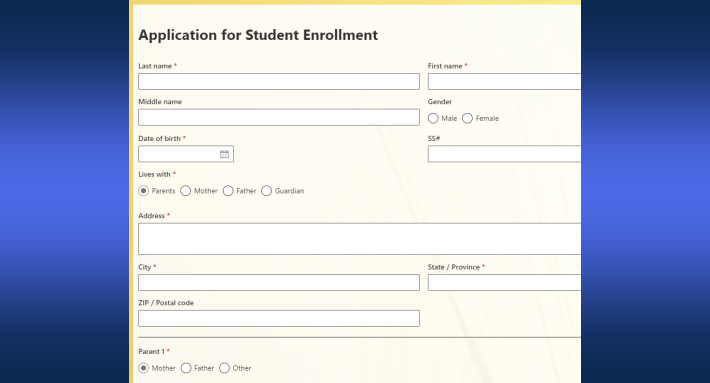
Summaries aggregate children, so the parent-child link comes first. The Associated Items column establishes it, turning flat lists into relational structures: tasks under projects, line items under invoices, sessions under employees. Children are created, viewed, and managed right inside the parent form.
The link itself works two ways. A standard lookup column in the child list pointing to the parent is the simple path, auto-filled as children are created. Associated content types are the flexible path: hidden relationship columns managed by the platform, which allow several associated columns in one list, corrective and preventive actions side by side, say.
Data entry adapts to the children's complexity. A pop-up form suits complex child records with their own logic. A grid inside the parent form suits fast tabular entry, expense lines being the classic. An embedded form renders each child as a small form within the parent, for records that need layout and logic but not a separate window.
What a summary can compute
With the relationship in place, the Summary column aggregates over it.
Count answers how many: line items on the invoice, open tasks on the project. Sum and Average carry the money and the metrics: the invoice total, the average resolution time. Minimum and Maximum work on numbers and dates alike, so the earliest due date and the largest charge are both one column away. Standard deviation serves the statistically inclined. And Concatenate joins text, gathering the children's comments or outcomes into one parent column, which audits and reports quietly love.
Non-numeric target columns support Count and Concatenate; the arithmetic operations need numbers or dates. One parent can carry several summaries, and usually should: the count beside the total beside the latest date is a dashboard row in itself.
The defining property is the recalculation. Add, edit, or delete a child, and the summary updates, even when the change happens outside the parent form. Nobody refreshes anything, and the stored value is always the current truth.
Setting one up
- Make sure the Associated Items column exists on the parent list.
- Add a new Associated Items Summary column.
- Configure three settings: the Associated Items column it summarizes (the relationship), the child column to calculate, and the operation.
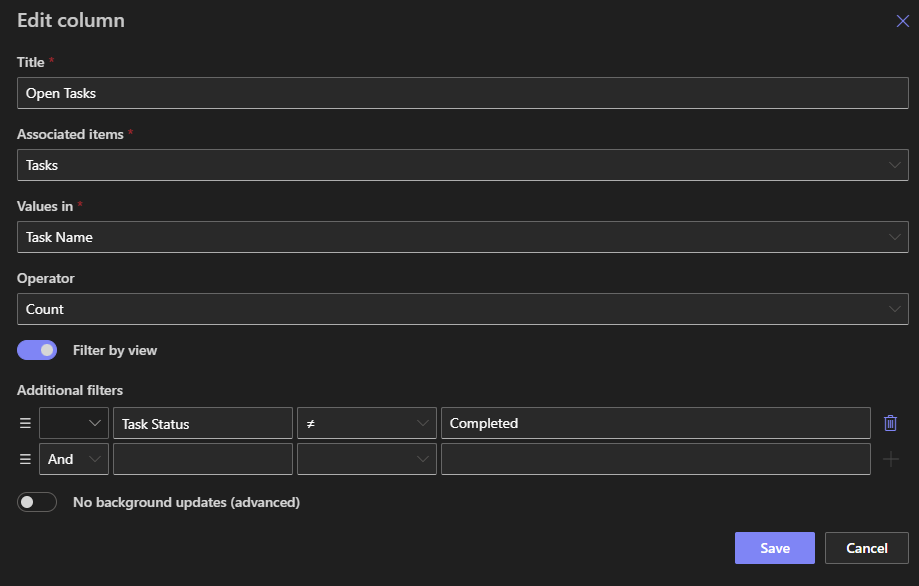
The fourth setting is where summaries get smart: conditions. Filter the children that count, only tasks where Status is not Completed, only invoices marked Approved, only entries from this quarter. One relationship can then feed several conditional summaries: total tasks, open tasks, and overdue tasks as three columns over the same children.
From numbers to rules
A summary stored on the parent is a value the whole platform can act on, and that is where it earns its keep.
Validation turns summaries into gates. A rule on the parent form blocks saving when the summary says no: a project cannot close while Count of Open Tasks is above zero, and an invoice cannot finalize with no line items. The validation guide covers the rule side; the summary supplies the fact.
Conditional behavior uses the same values for softer signals: a warning banner when the total crosses the budget, a highlighted section when the average slips.
Automation closes the loop. When a summary crosses a threshold, actions respond: notify the owner, escalate the status, launch the next step. And the related Calculate Summary action extends the idea beyond associated items, computing across any list to update items or block operations, preventing a booking when scheduled hours exceed the quota, say.
Five places the bottom line lives
Invoices. The total sums the line items, the count guards completeness, and finalizing is blocked while either says the record is not ready.
Projects. Open tasks counted by condition, average time-to-close computed live, and closure gated until the open count reaches zero.
Support. Average resolution time and escalation counts per category, feeding SLA reporting without an export.
Sales. Total order value and average order size per customer, updating as orders are logged.
Training and inventory. Hours and session counts per employee for compliance; quantities and stock value per item for operations. The same shape every time: children carry the detail, the parent carries the verdict.
A worked example: the invoice that checks itself
The pattern assembled once, end to end.
An Invoices list carries an Associated Items column pointing at Invoice Lines, entered through the grid for speed. Three summary columns sit beside it. Total sums the lines' Amount. Line Count counts them. Flagged Lines counts with a condition: only lines where Status equals Error.
Two validation rules read those columns. The invoice cannot move to Final while Line Count is zero, and cannot move at all while Flagged Lines is above zero. The person finalizing never checks anything; the form already did.
Then the downstream takes over. The approval route reads Total, sending large invoices up a level. The print template renders the lines with the Total beneath them, and the generated PDF carries the same number the form enforced. One relationship, three summaries, two rules, and the invoice process stops producing incomplete records, because incomplete records stop being savable.
Swap the nouns and the build serves projects, orders, or training plans unchanged. The design work is naming what the bottom line is; the platform does the arithmetic forever after.
Summaries across the platform
The stored value travels everywhere the item does. Print templates render summaries alongside the children they total, so the invoice PDF shows its lines and its bottom line from the same machinery. Alerts carry them into inboxes. Views group and sort by them, high totals first, overdue counts on top. And tabs keep the form tidy, the summaries displayed beside the child grid they describe.
They also complete the dashboard stack from the item side. Counters aggregate across items on a page; summaries aggregate within an item's children and store the result. The two meet on dashboards, where a counter can total a summary column across the list: the sum of sums, live, with no BI platform involved.
Two habits keep large solutions fast. Apply summaries where they inform decisions rather than everywhere a number exists, and keep conditions narrow, so each recalculation touches the children that matter. A summary is cheap; a hundred needless ones on a huge list are not. And name the columns for what they mean, Open Tasks rather than Summary 2, because these values end up in rules, views, and documents, where their names do the explaining.
Frequently asked questions
Add your comment