Creating and Configuring Filters
In this tutorial, you will learn how to create and configure filters using Ultimate Forms: Filters.
You will build a filtering panel that allows users to dynamically refine data displayed on a SharePoint page. Filters can interact with web parts and update their data instantly based on user selection.
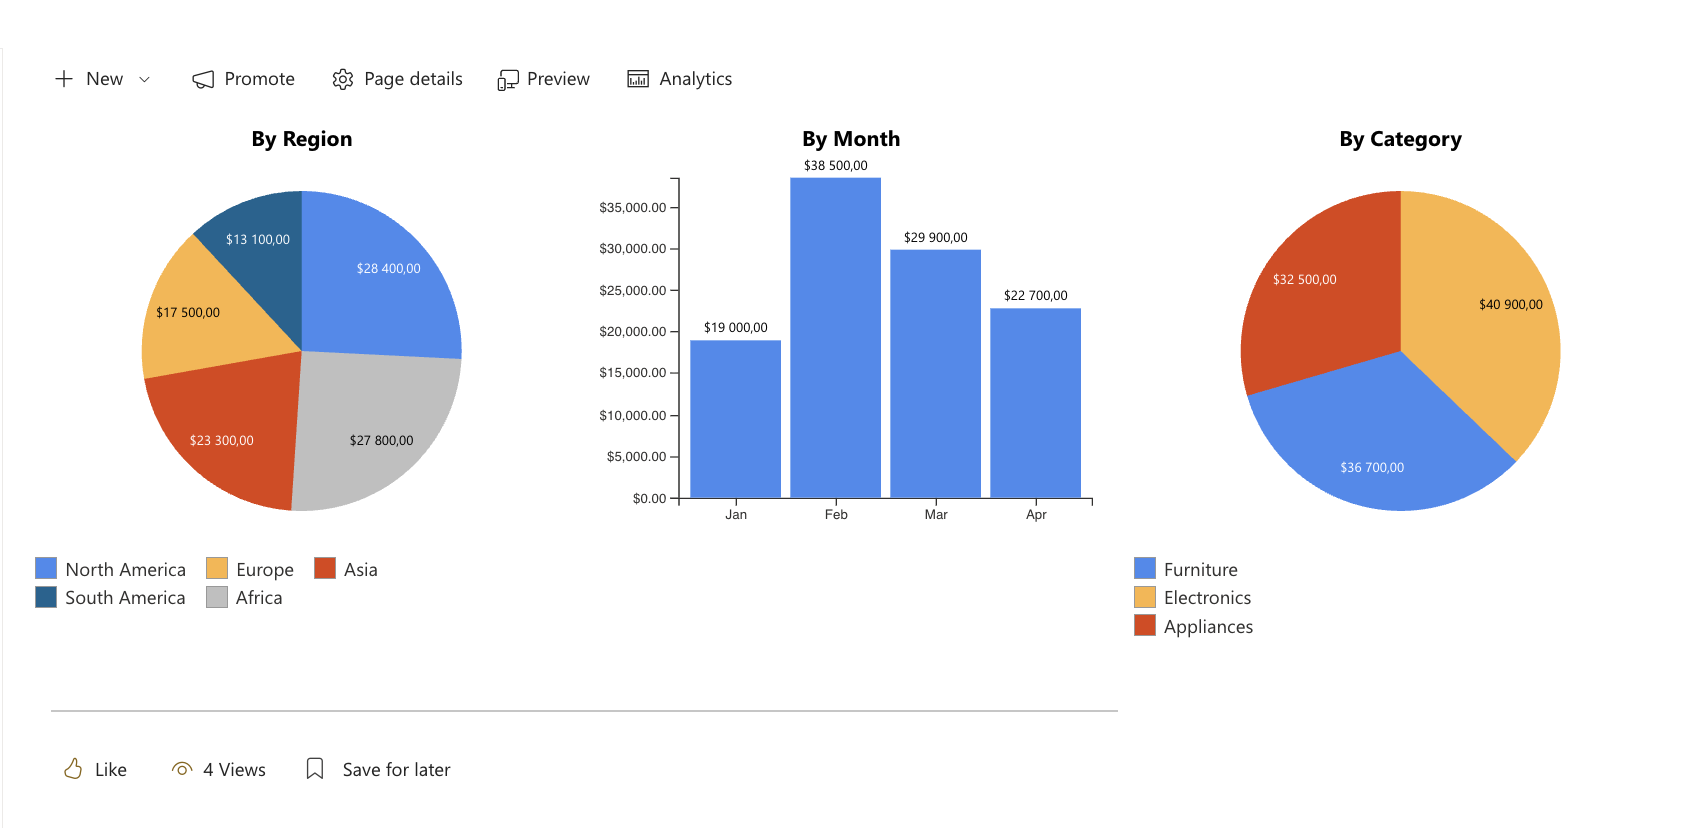
In this example, you will work with a Sales Dashboard page that already contains multiple charts based on the Sales Tracking list.
The page includes:
- a chart showing sales by region
- a chart showing sales by month
- a chart showing sales by category
You will create a filter panel and connect it to these charts to enable interactive data exploration.
Instructions
Before You Start
Make sure you already have:
-
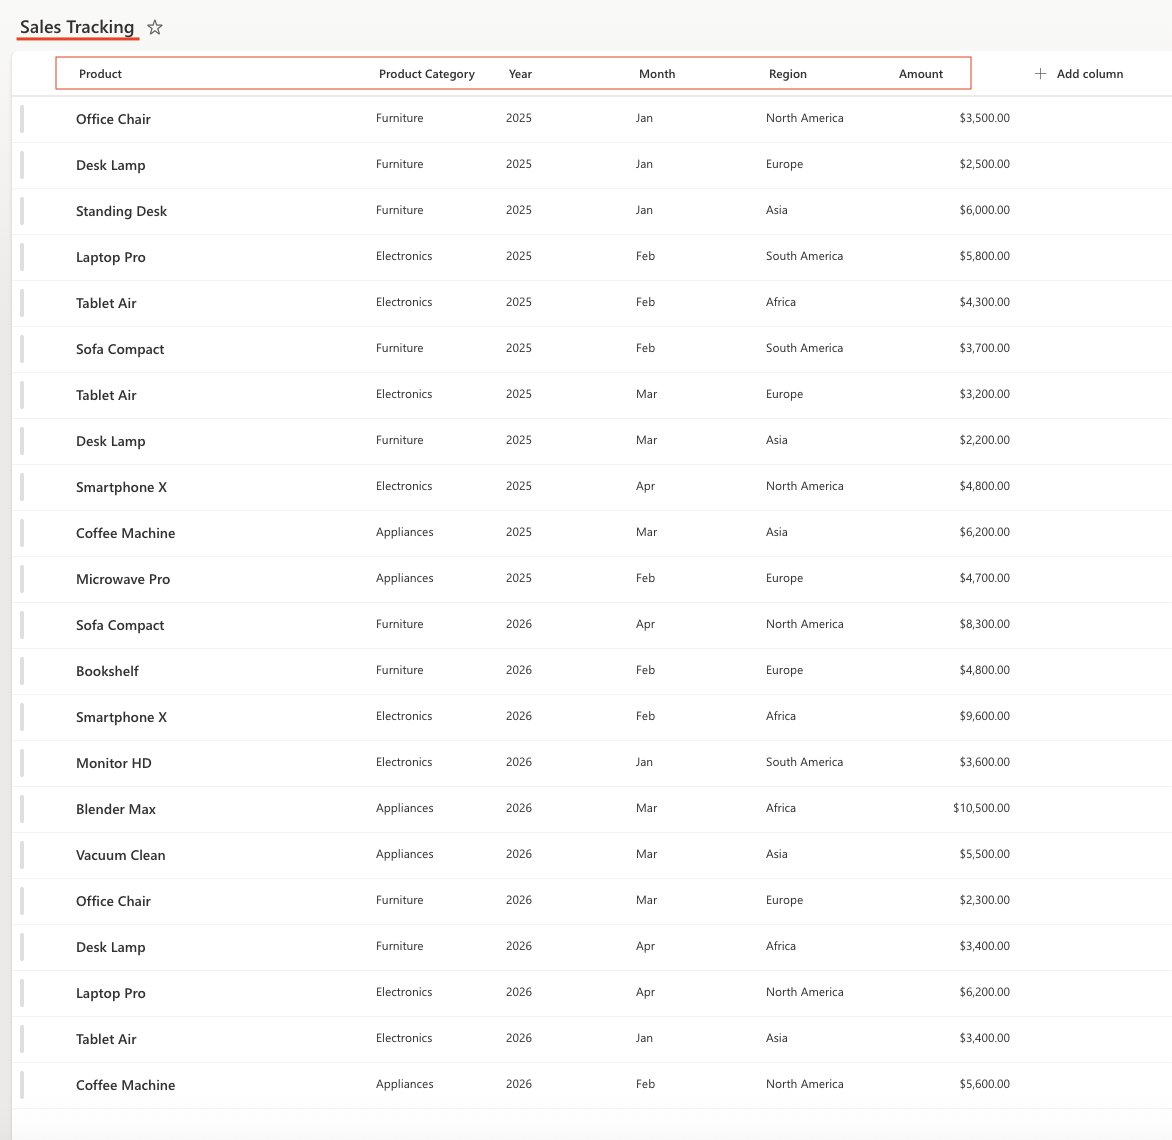
A SharePoint list
List name: Sales Tracking
Columns:
- Product (Single line of text)
- Product Category (Choice)
- Year (Choice or Number)
- Month (Choice)
- Region (Choice)
- Amount (Currency)
- A page with charts
Create a SharePoint page (for example, Sales Dashboard) and add three Ultimate Forms: Charts web parts:
- By Region (Pie chart, grouped by Region)
- By Month (Column chart, grouped by Month)
- By Category (Pie chart, grouped by Product Category)
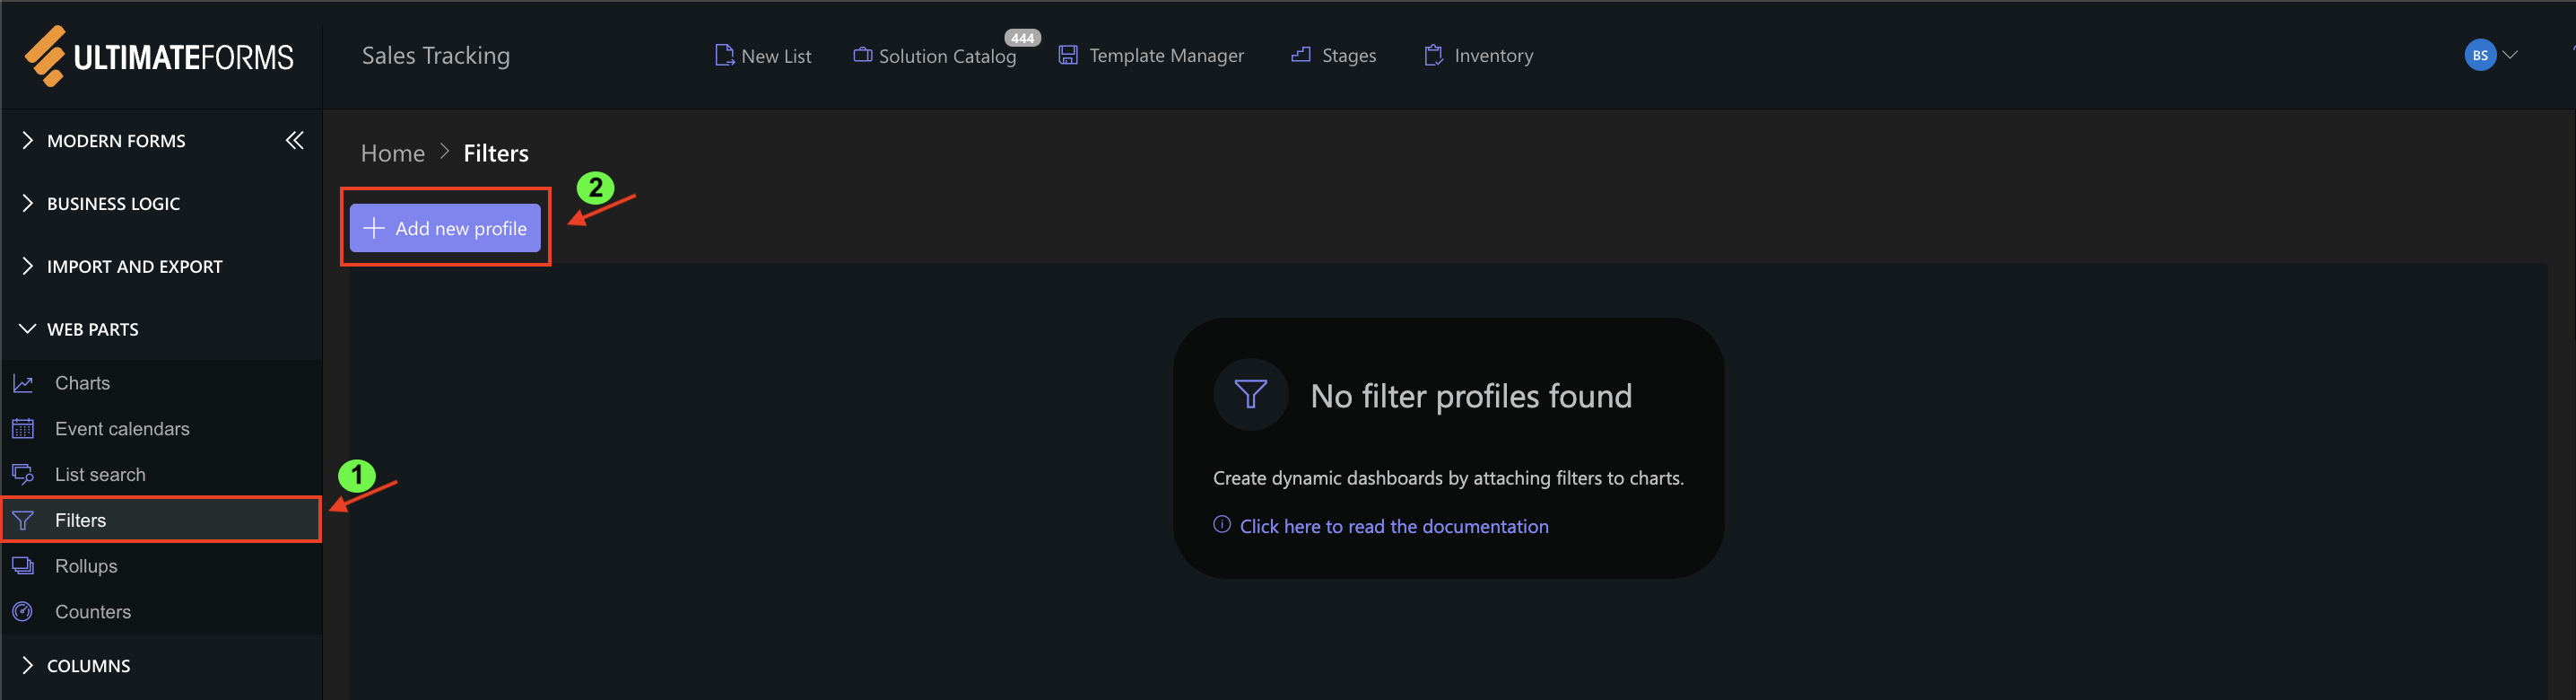
Step 1: Create a Filters profile
- Go to Ultimate Forms → Filters
- Click Add new profile
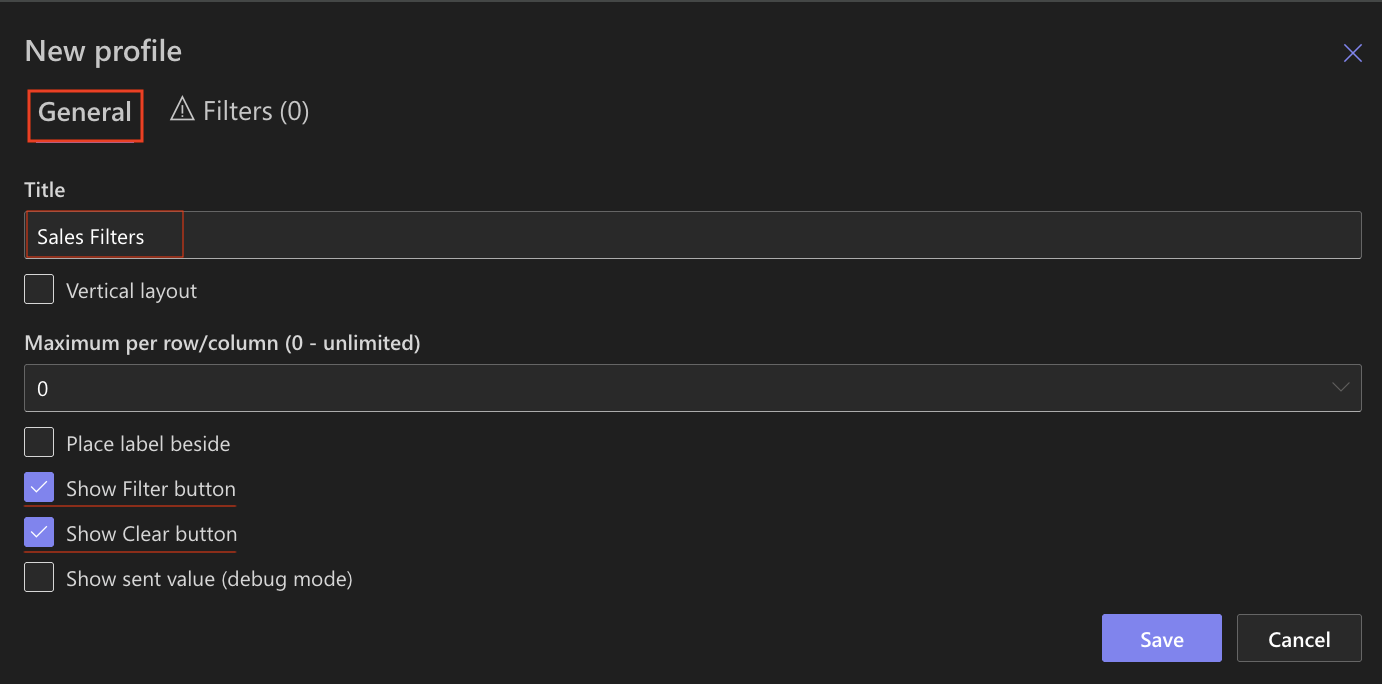
General settings:
- Title: Sales Filters
- Vertical layout: Disabled (for horizontal layout)
- Maximum per row/column: 0 (auto layout)
- Show Filter button: Enabled
- Show Clear button: Enabled
Step 2: Add filters
Go to the Filters tab and add the following filters:
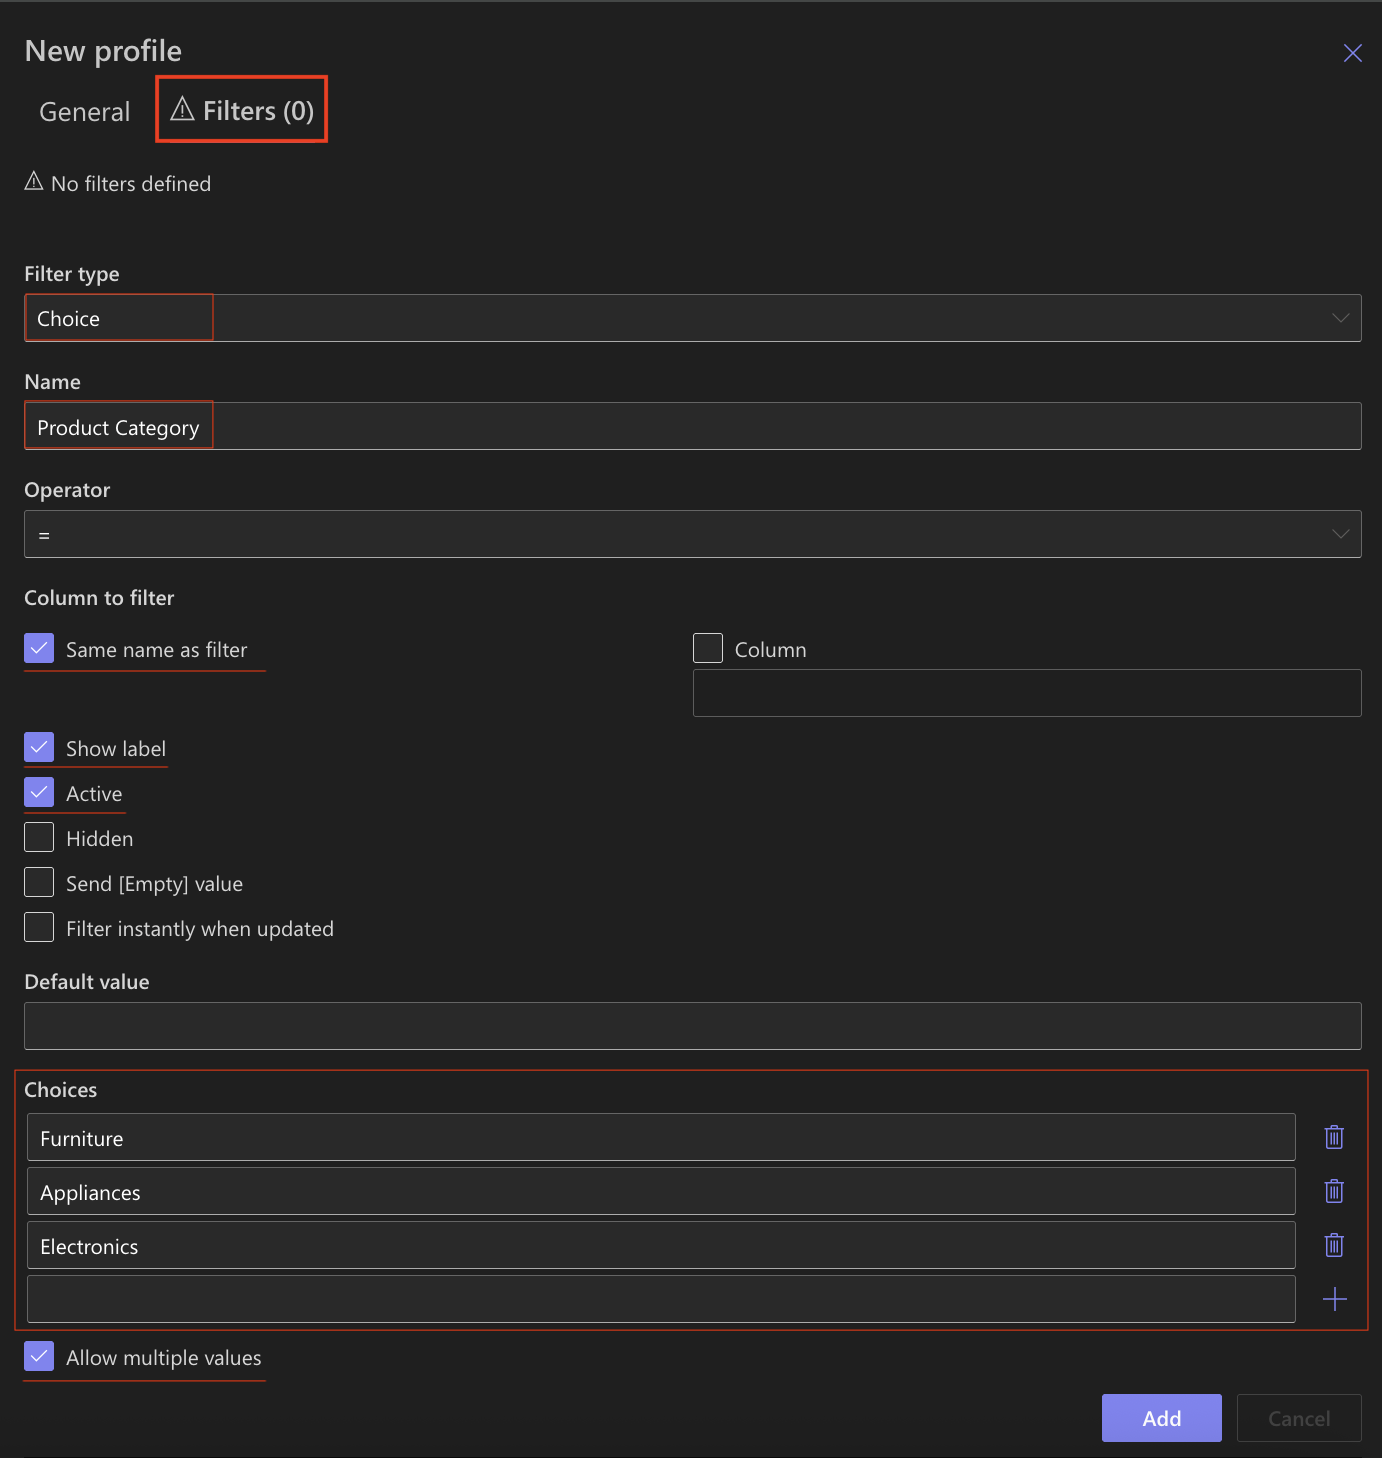
Filter 1 — Product Category
- Filter type: Choice
- Name: Product Category
- Column to filter: Same name as filter
- Show label: Enabled
- Active: Enabled
- Choices: Furniture,Appliances, Electronics
- Allow multiple values: Enabled
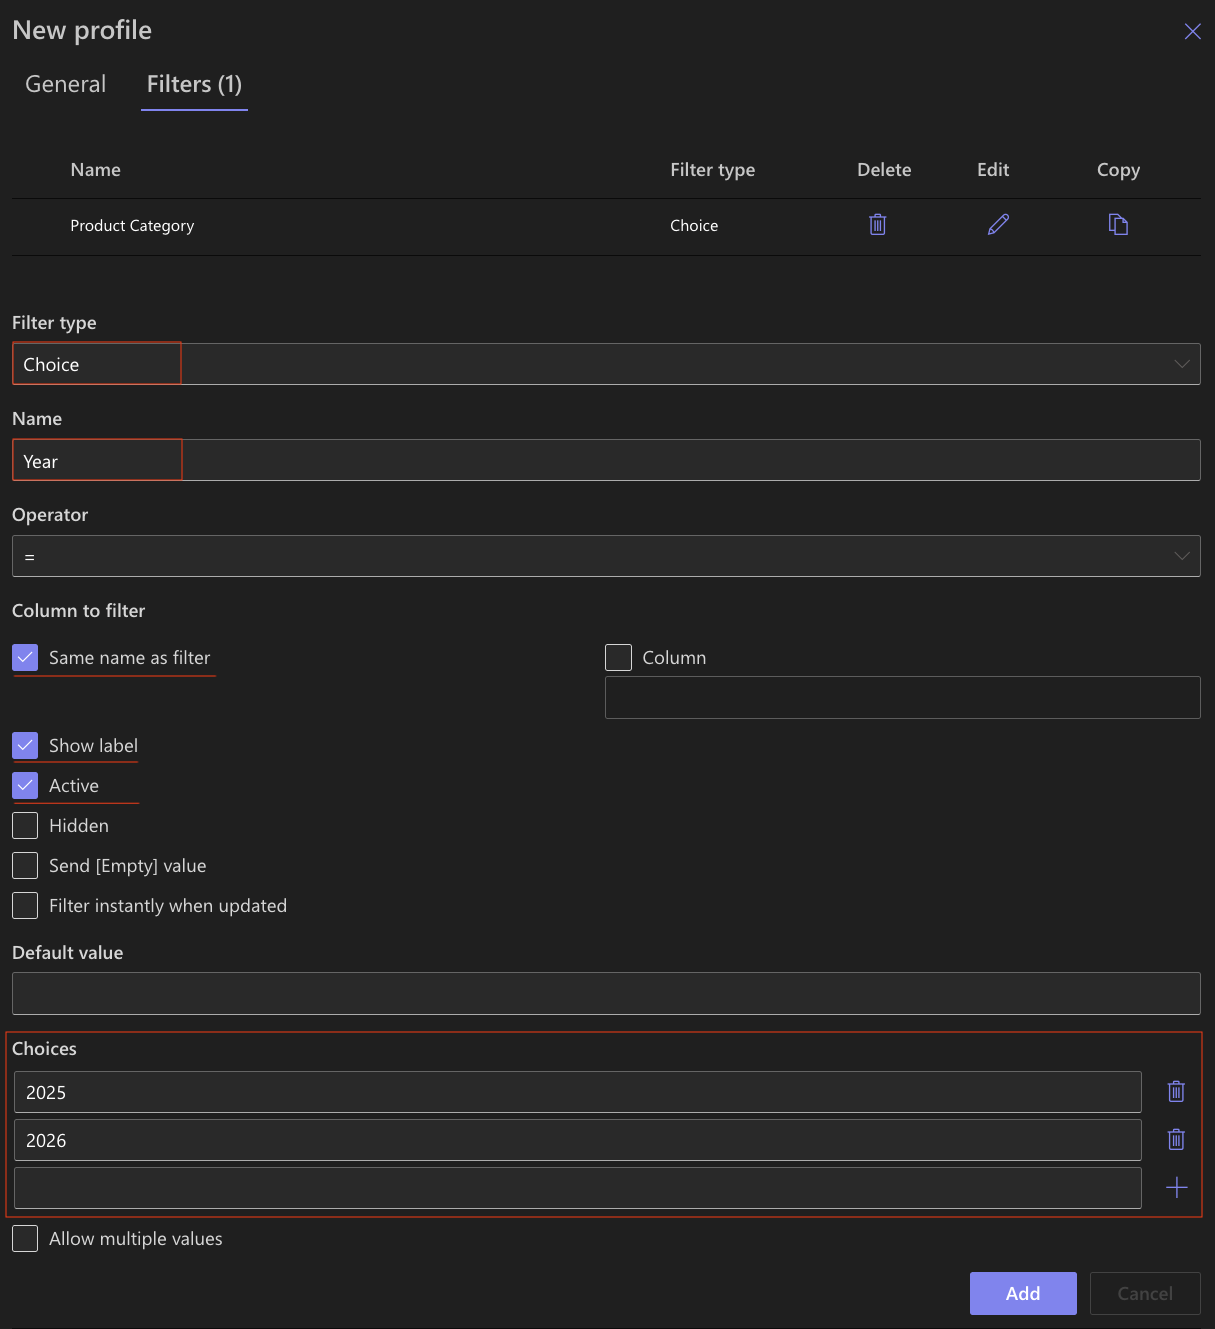
Filter 2 — Year
- Filter type: Choice
- Name: Year
- Column to filter: Same name as filter
- Show label: Enabled
- Active: Enabled
- Choices: 2025, 2026
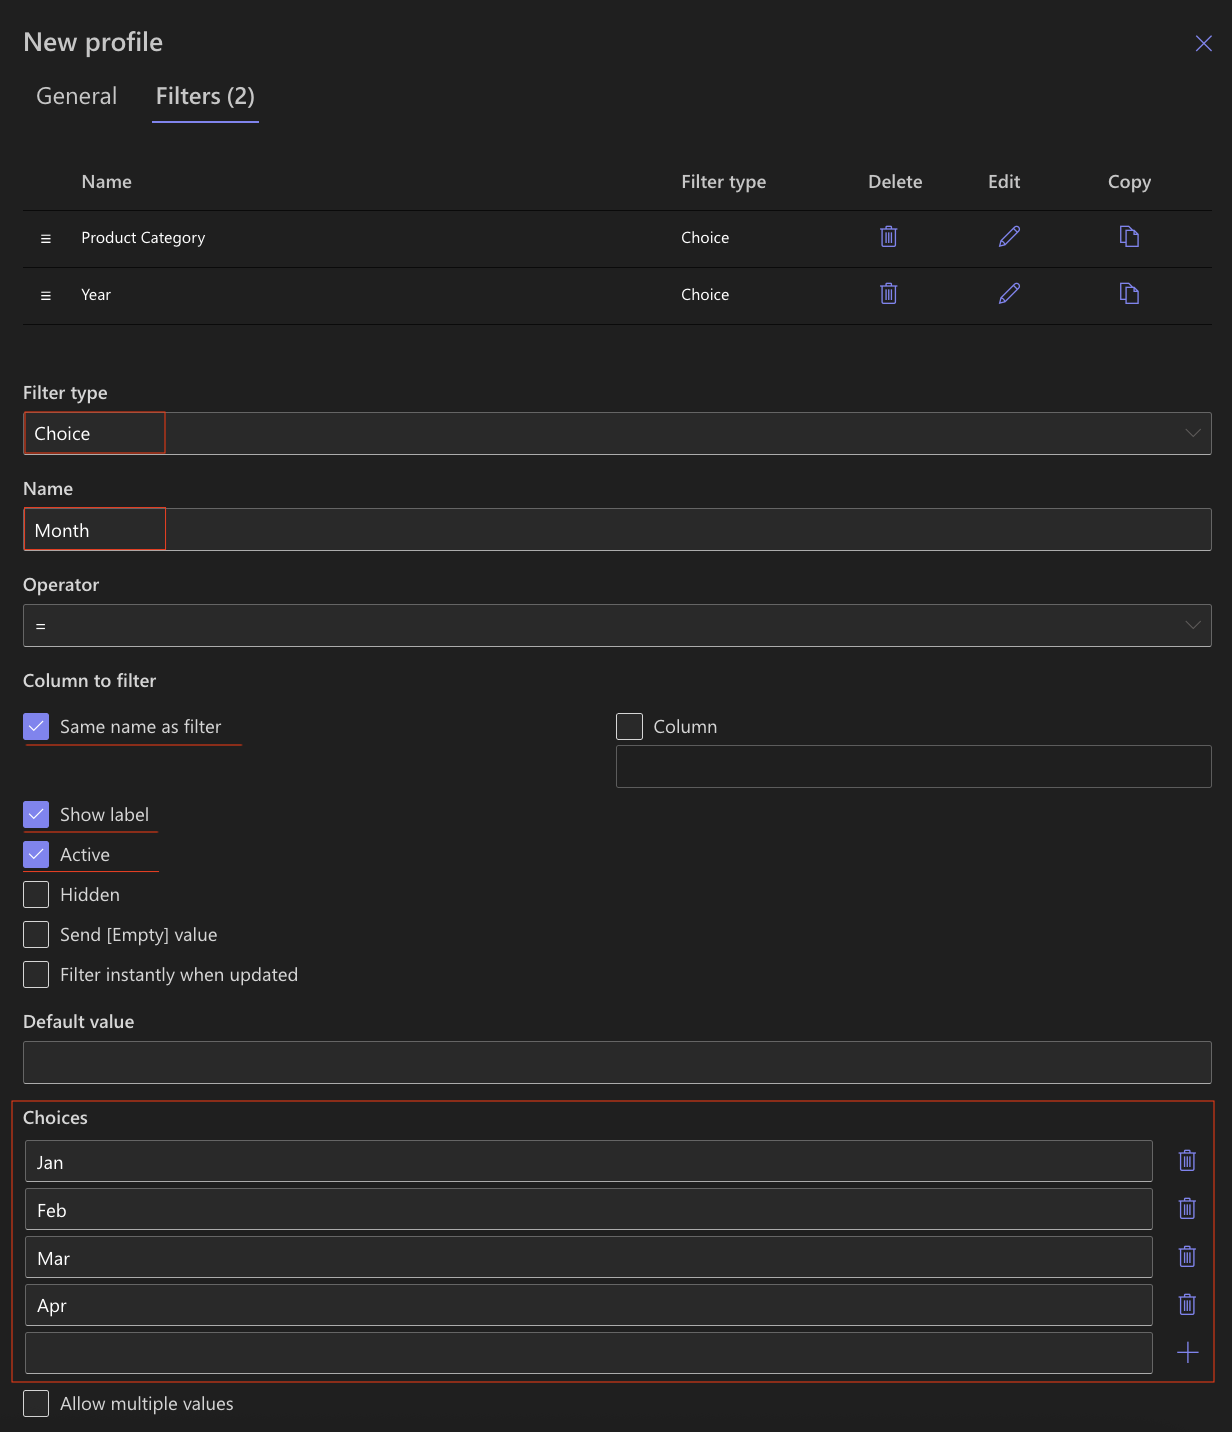
Filter 3 — Month
- Filter type: Choice
- Name: Month
- Column to filter: Same name as filter
- Show label: Enabled
- Active: Enabled
- Choices: Jan. Feb, Mar, Apr
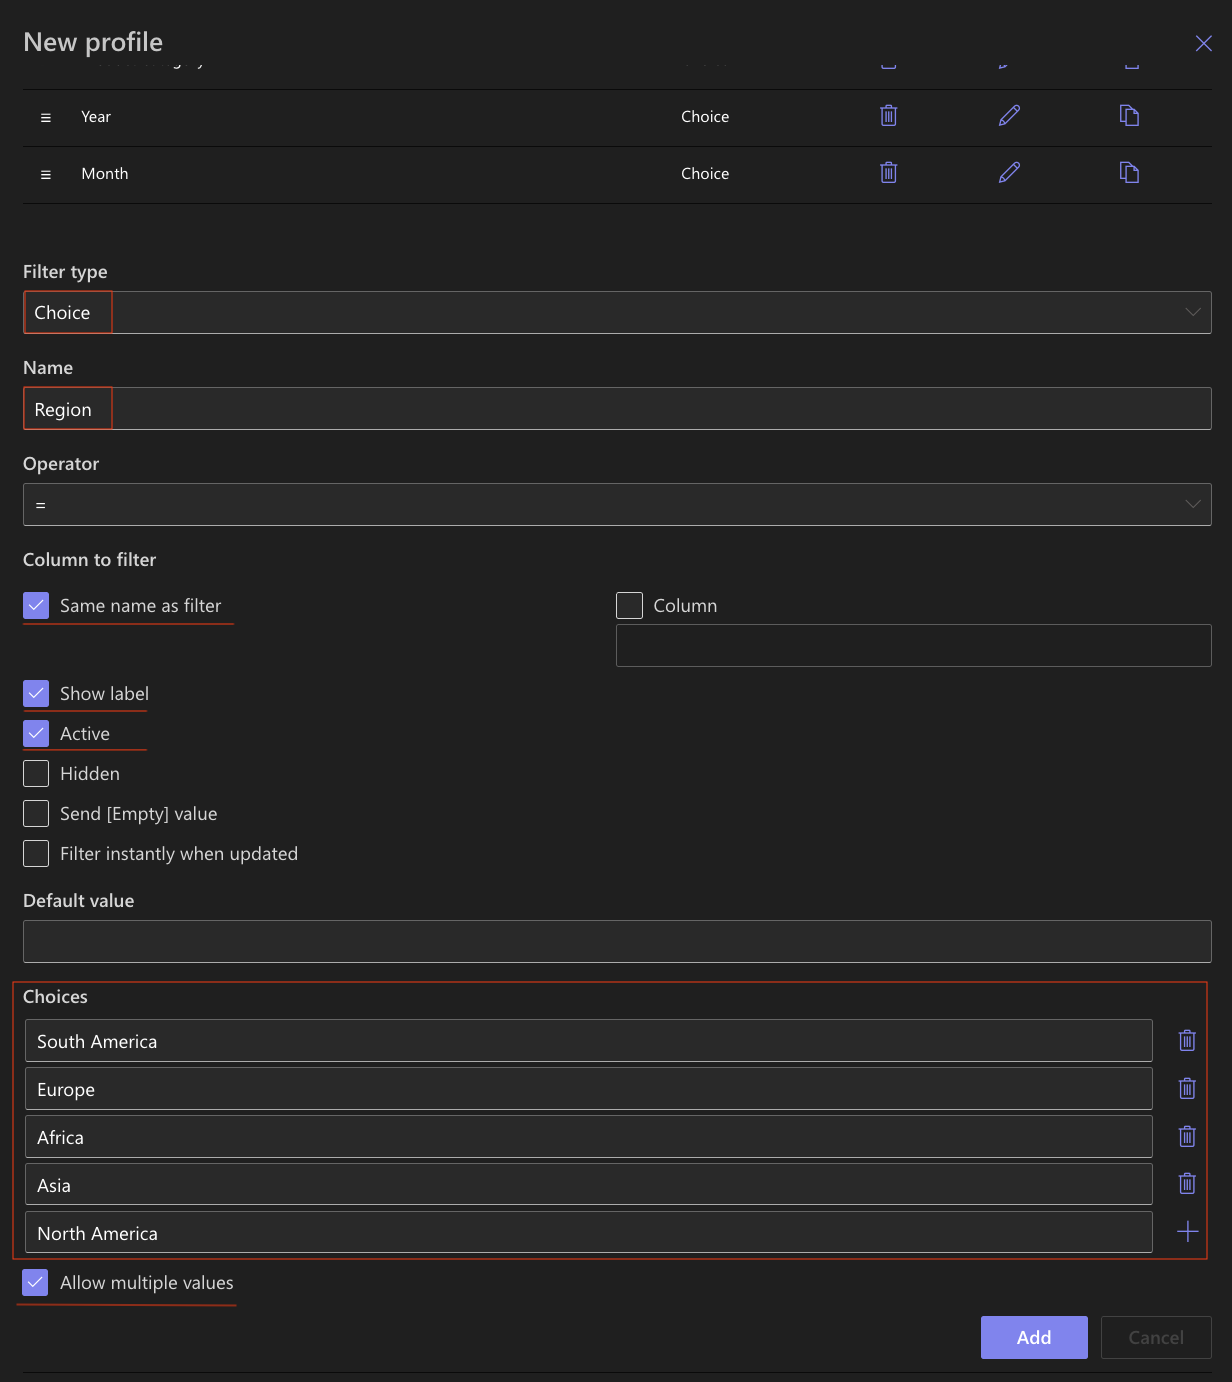
Filter 4 — Region
- Filter type: Choice
- Name: Region
- Column to filter: Same name as filter
- Show label: Enabled
- Active: Enabled
- Choices: South America, Europe, Africa, Asia, North America
- Allow multiple values: Enabled
- Click Save.
Step 3: Add Filters web part to the page
- Open your Sales Dashboard page
- Click Edit
- Click the + button and add the Ultimate Forms.
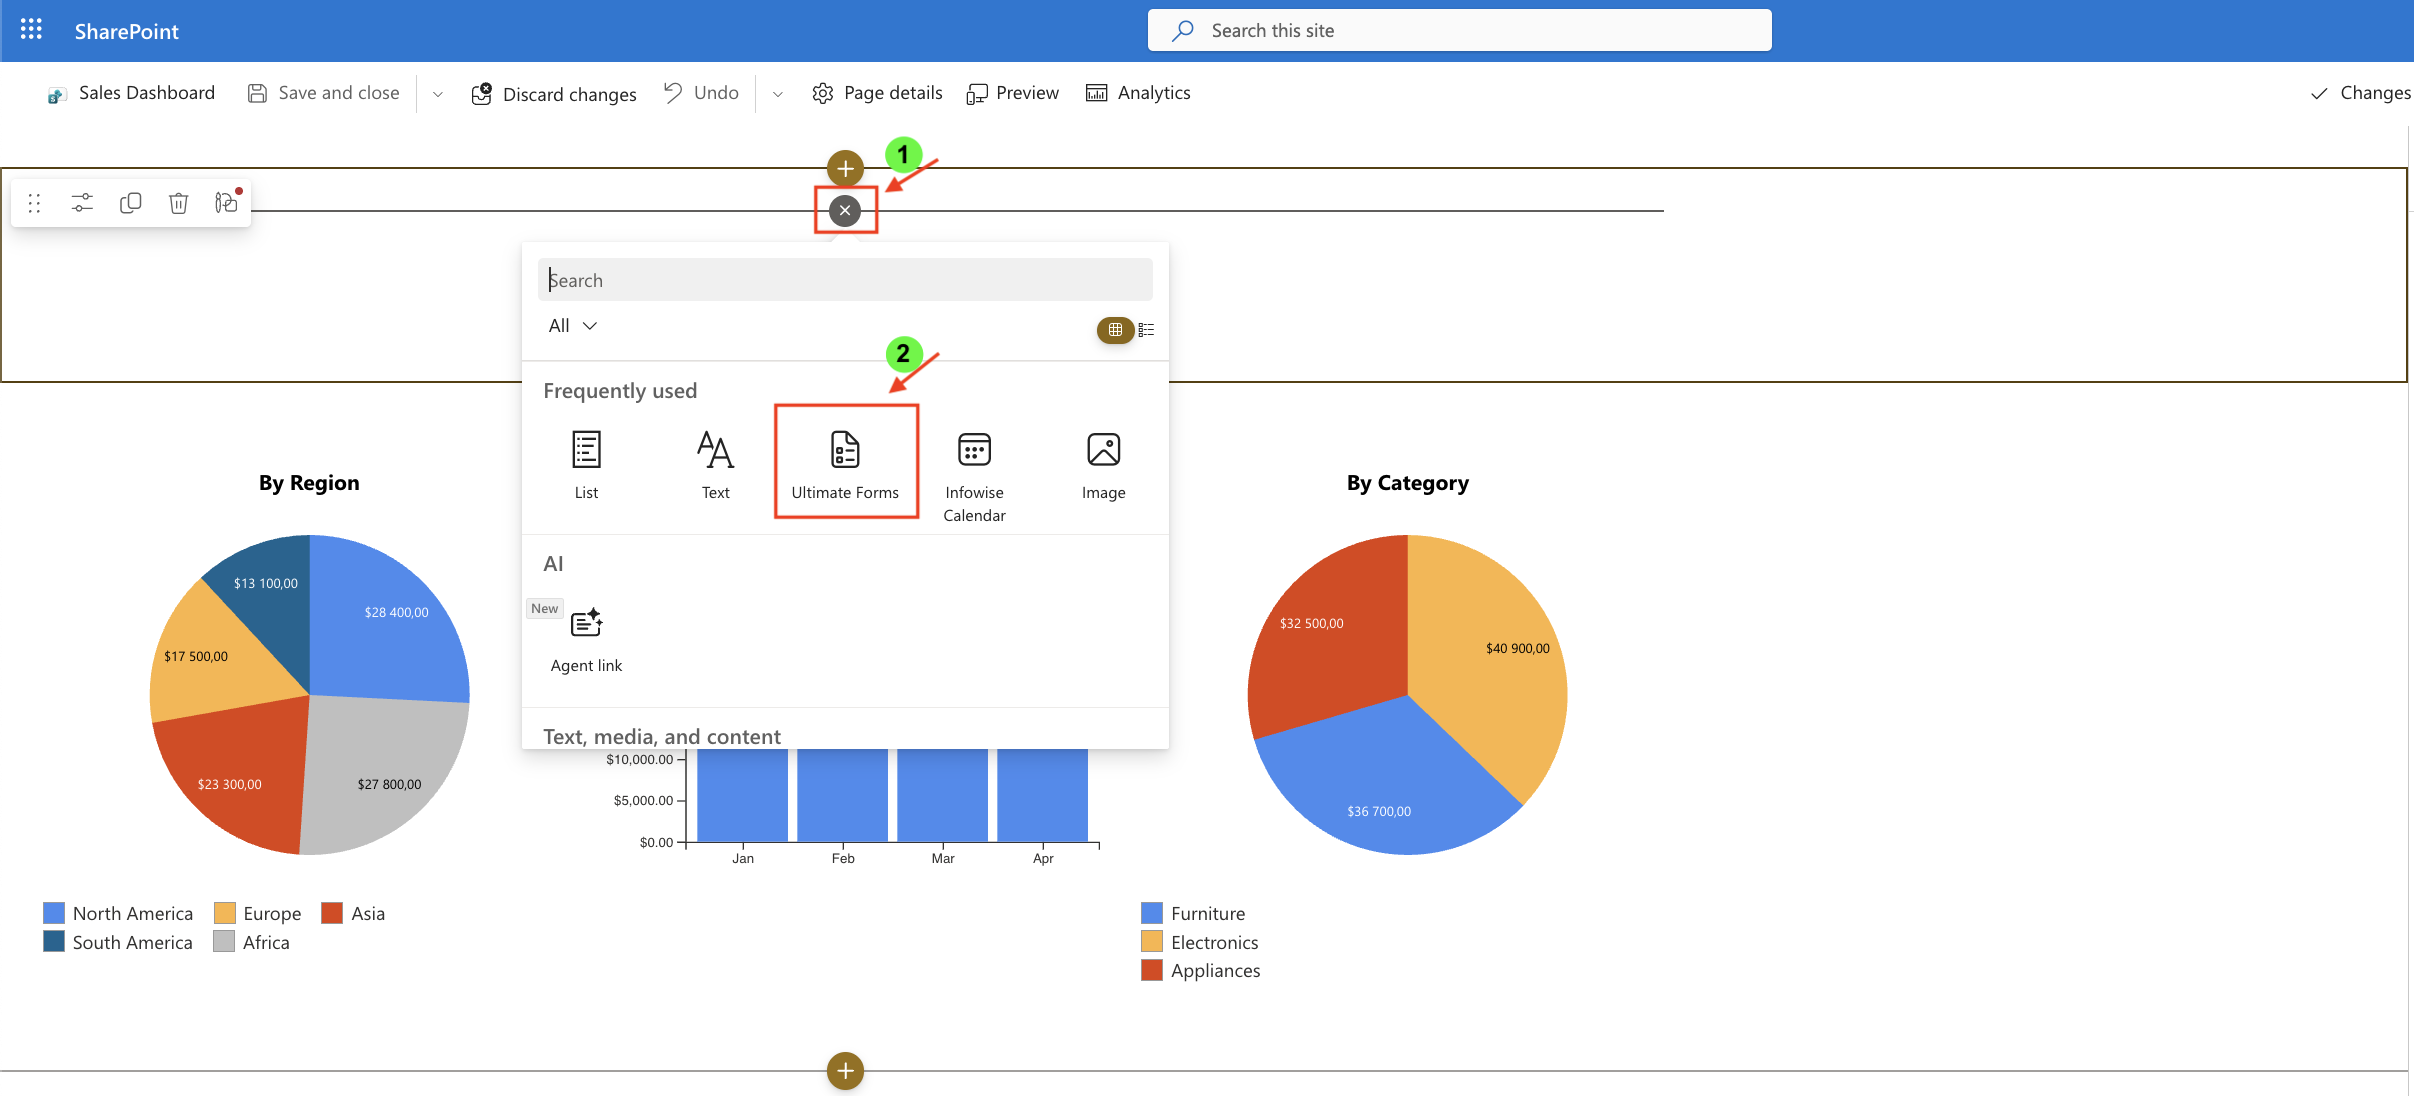
- Once added, click the Edit Properties.
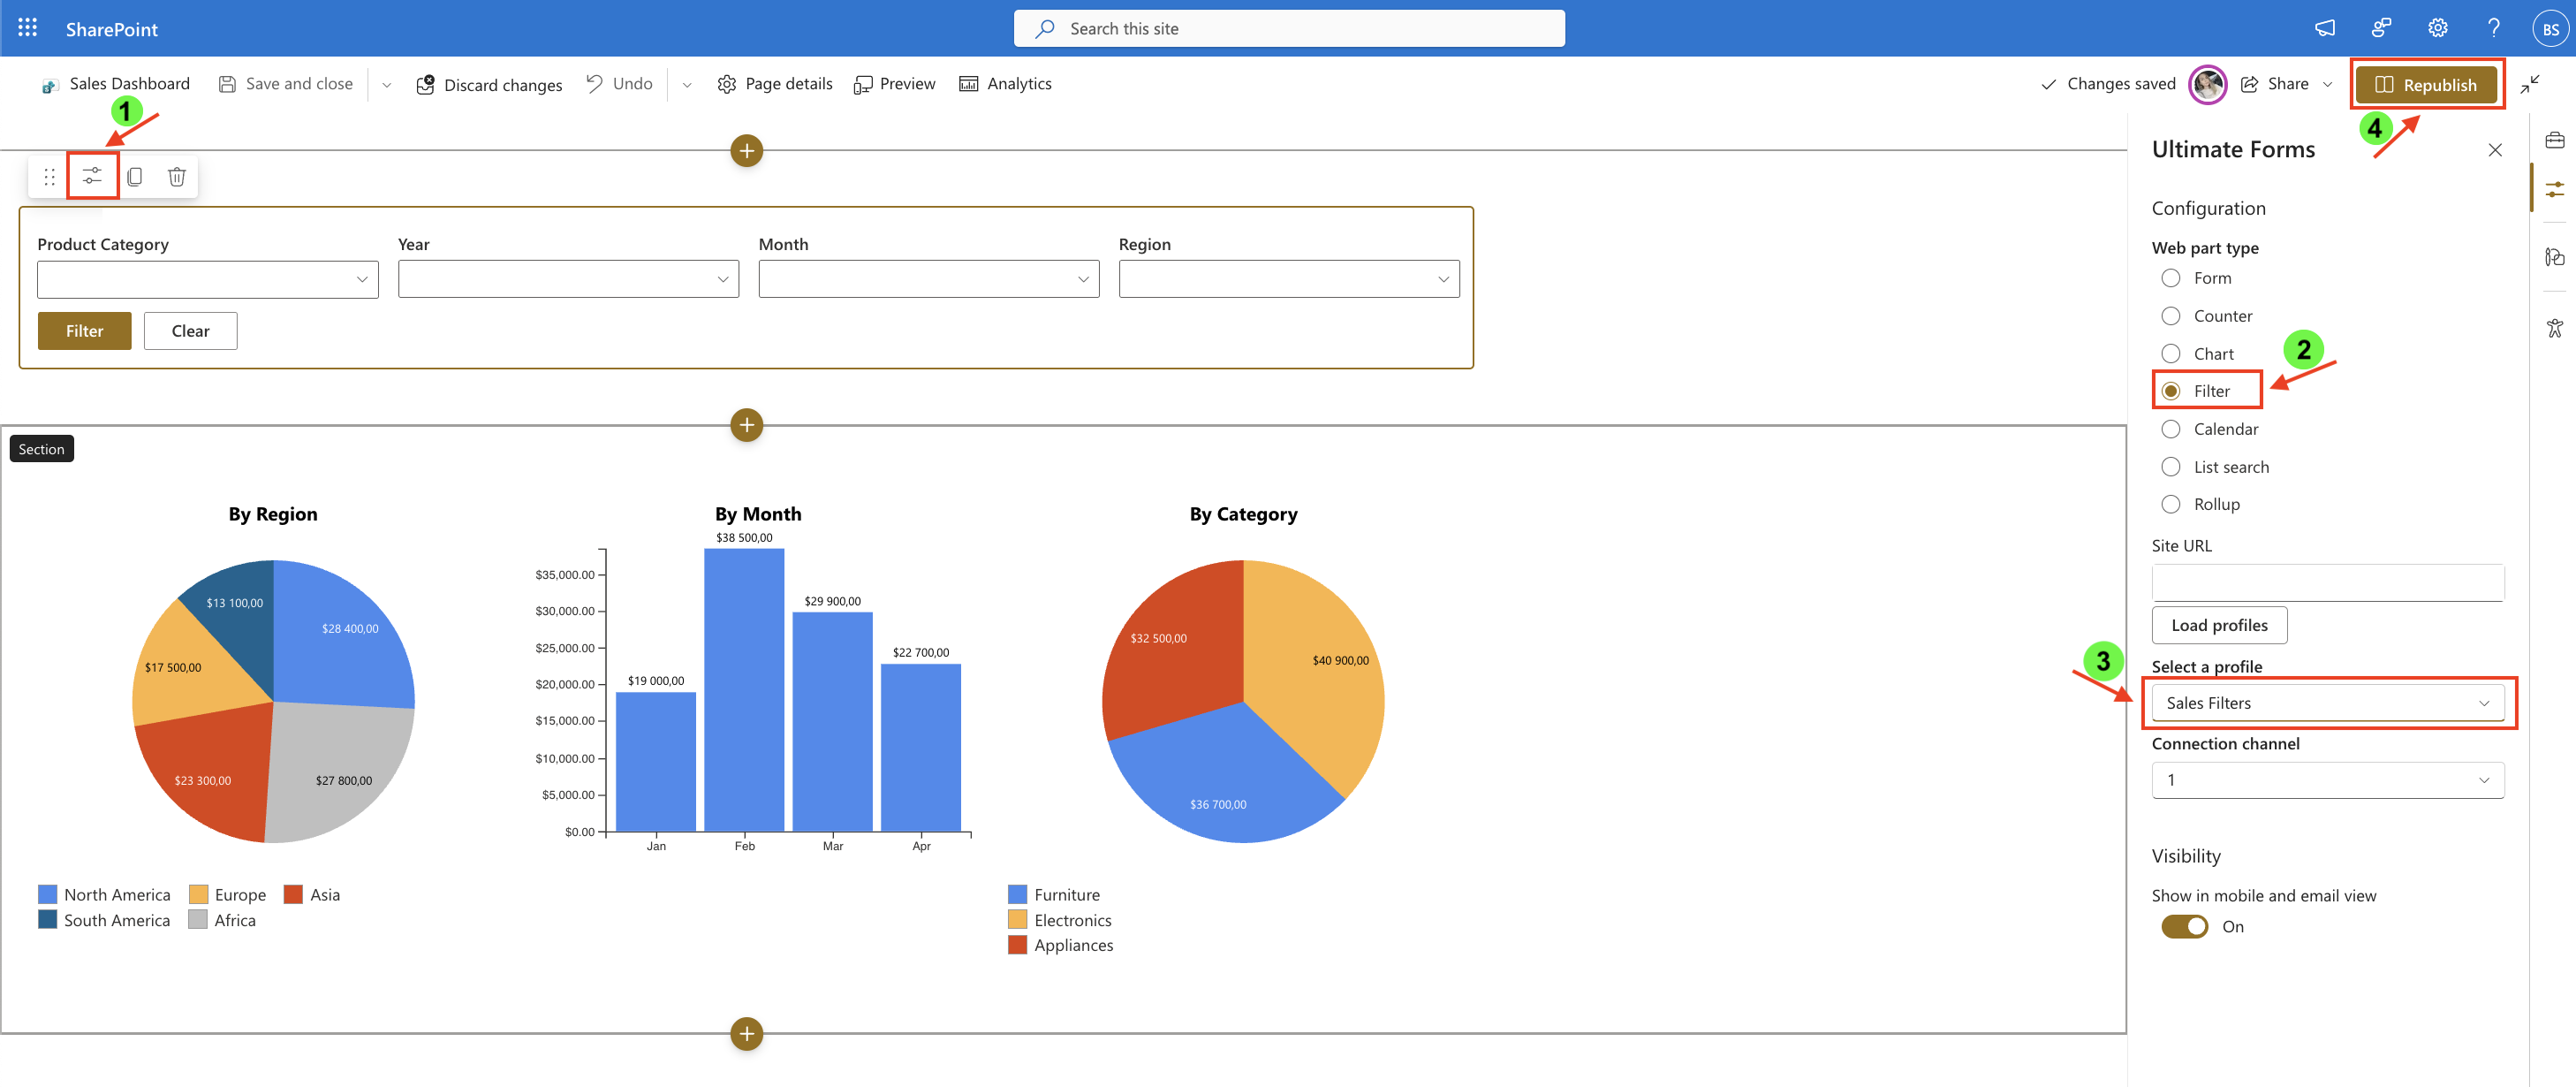
- In the web part properties:
- Set Type to Filter
- Select the profile: Sales Filters
- Republish the page
Result
You now have a dynamic filtering panel that allows users to interactively control the data displayed on the page.
All charts respond to the selected filters, making it easier to analyze and explore data from different perspectives.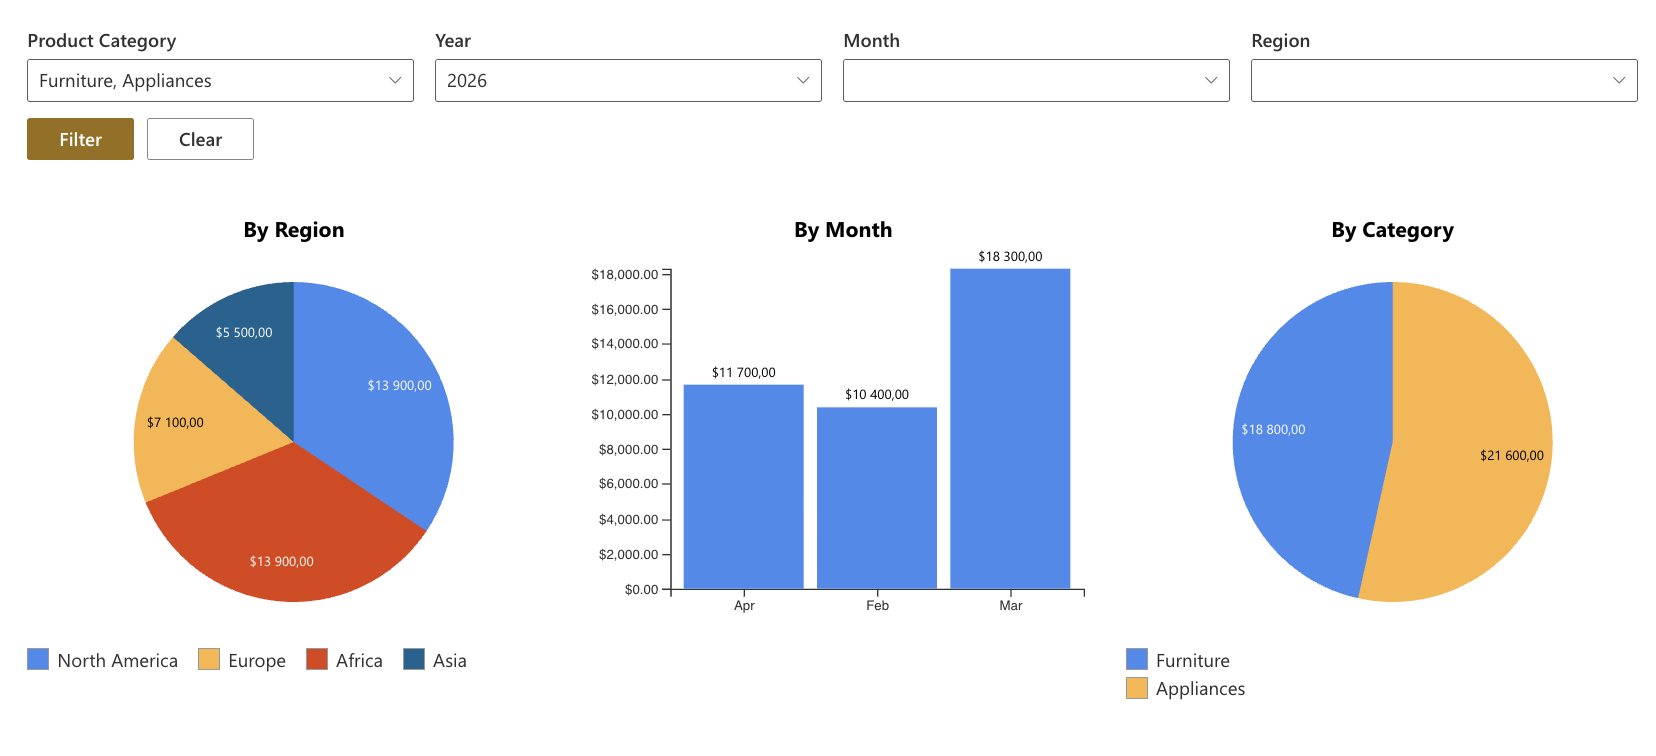
Summary
In this tutorial, you learned how to:
- create a Filters profile
- configure different filter types
- add filters to a SharePoint page
- use filters to dynamically update data
This is the foundation for building interactive dashboards using Ultimate Forms: Filters.