Counters with Views and Links
Counters are often the first thing users see on a SharePoint dashboard.
They provide quick answers such as How much?, How many?, or Is this increasing or decreasing?
In this tutorial, you will learn how Ultimate Forms: Counters can be made more meaningful and actionable by:
- reusing list views
- applying counter conditions correctly
- turning counters into clickable links
Instead of working with abstract examples, we will continue using a Sales Performance scenario so you can clearly see how these features work in practice.
What This Tutorial Is About
By the end of this tutorial, you will understand:
- how a counter decides which items to count
- why views are often better than complex conditions
- how users can click a counter to see the actual data behind the number
This tutorial focuses on using Counters, not just configuring them.
Instructions
Scenario: Sales Performance Dashboard
We continue working with the existing Sales Performance dashboard.
The dashboard contains the following Counters:
- Total Sales (Current Year)
- Sales in Europe (%)
- Sales Trend (comparison with the previous year)
These counters help users quickly understand:
- overall revenue
- regional contribution
- whether sales are growing or declining
Important:
For percentage counters, the selected view must represent the full data scope. If the view already limits the data (for example, Europe only), the percentage result will always be 100%, because there is nothing left to compare against.
Step 1: Why Views Matter for Counters
SharePoint views already represent familiar business questions, such as:
- “Show me all sales for this year”
- “Show me sales from Europe”
- “Compare this year with last year”
When Counters reuse views:
- logic stays consistent between lists and dashboards
- users can easily verify numbers
- configuration becomes easier to maintain
Step 2: Create Views Users Can Recognize
Open the Sales Records list and create the following views.
View: All Sales (2026)
This view represents the full sales scope for the current year.
- Filter: Year = 2026
Users immediately understand what this view shows.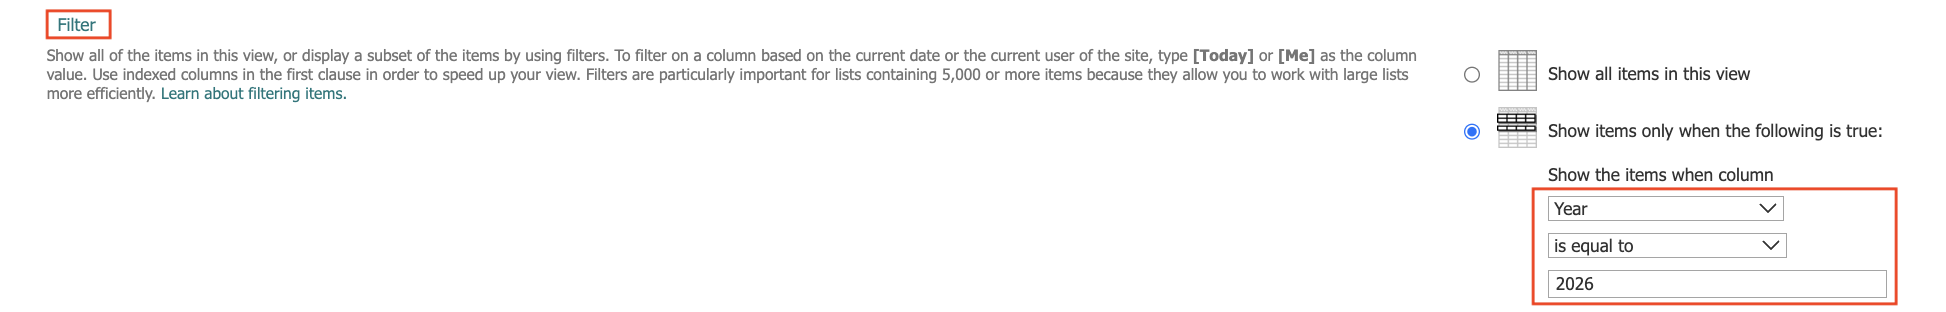
View: Europe Sales (2026)
This view shows sales for a specific region.
- Filter: Year = 2026
- Filter: Region = Europe
This view will later be used both by Counters and by users when drilling into details.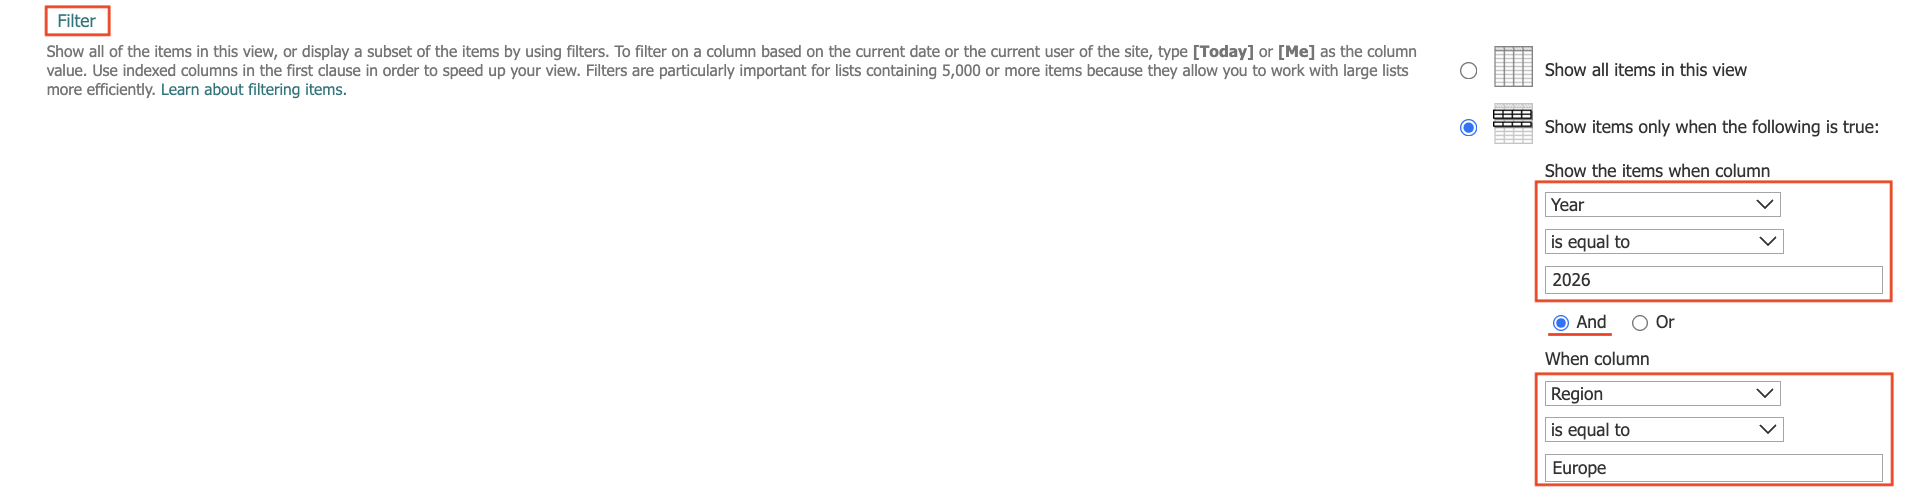
Important: This view represents only European sales, not the full data set. If this view is selected as Filter by view for a percentage counter, the result will always be 100%, because the total value is already limited to Europe.
This view should be used for:
- drill-down links
- detailed analysis
- list navigation
It should not be used as the main scope for percentage calculations.
Step 3: How Counters Use Views
Open the Sales Performance Counters profile.
When you assign a view to a counter:
- the counter uses the same data scope as the view
- the number shown on the dashboard matches what users see in the list
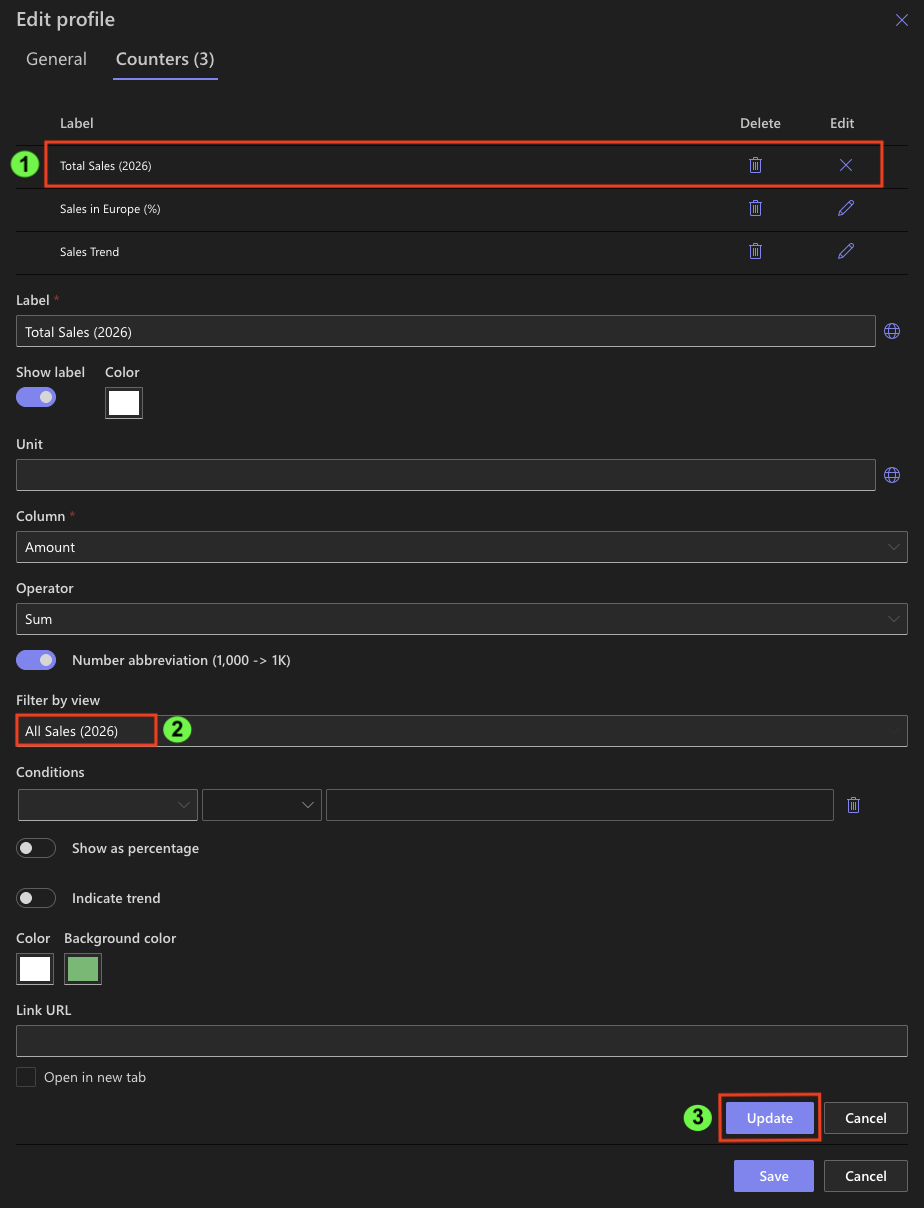
For example:
- Total Sales (2026) uses the All Sales (2026) view
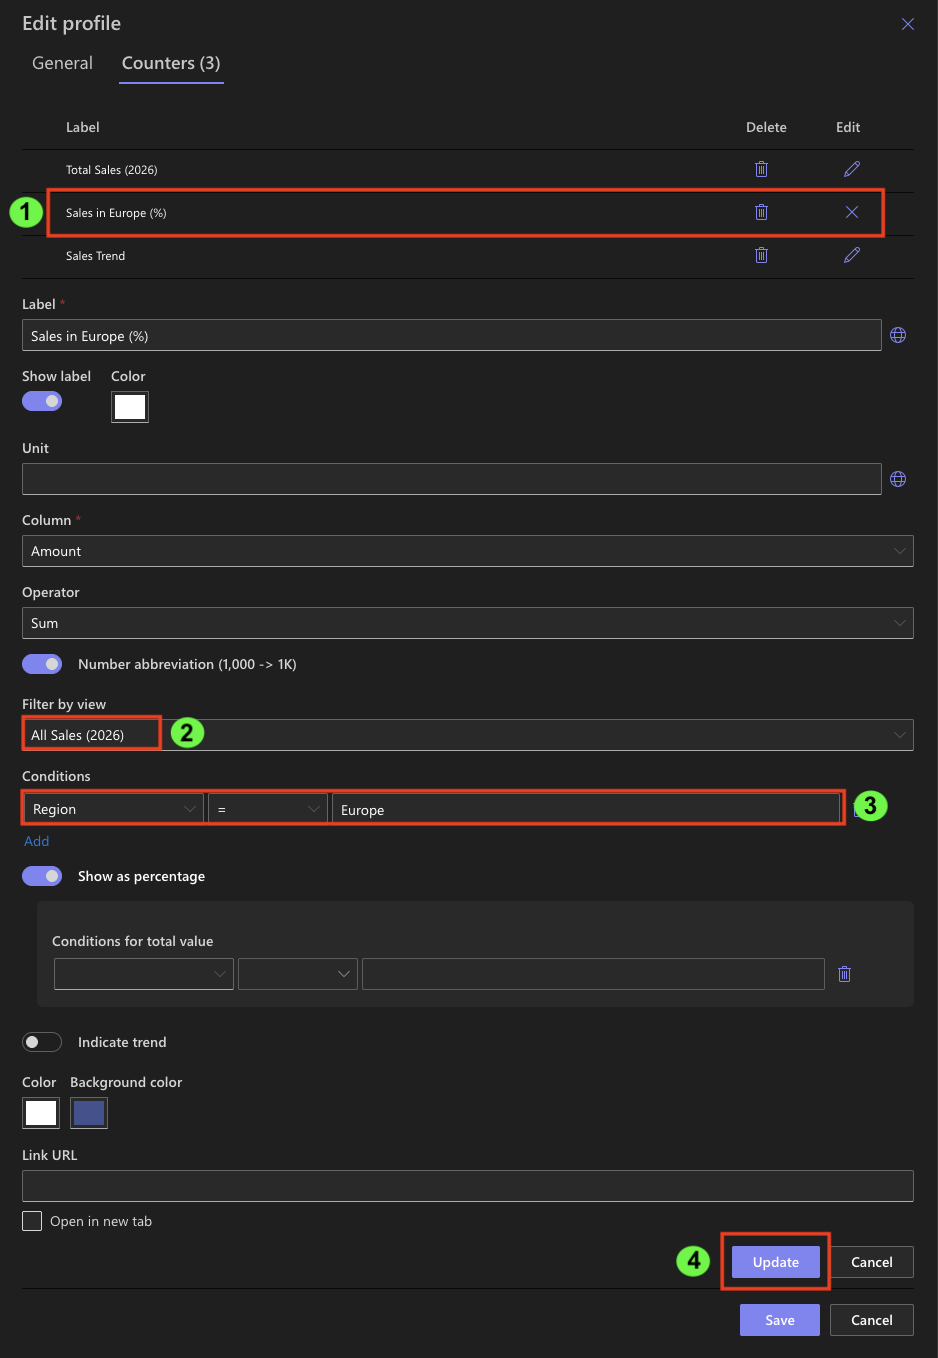
- Sales in Europe (%):
- the counter must use the All Sales (2026) view as its scope
- the Region = Europe filter is applied as a counter condition
- this allows the counter to correctly calculate Europe sales as a percentage of total sales.
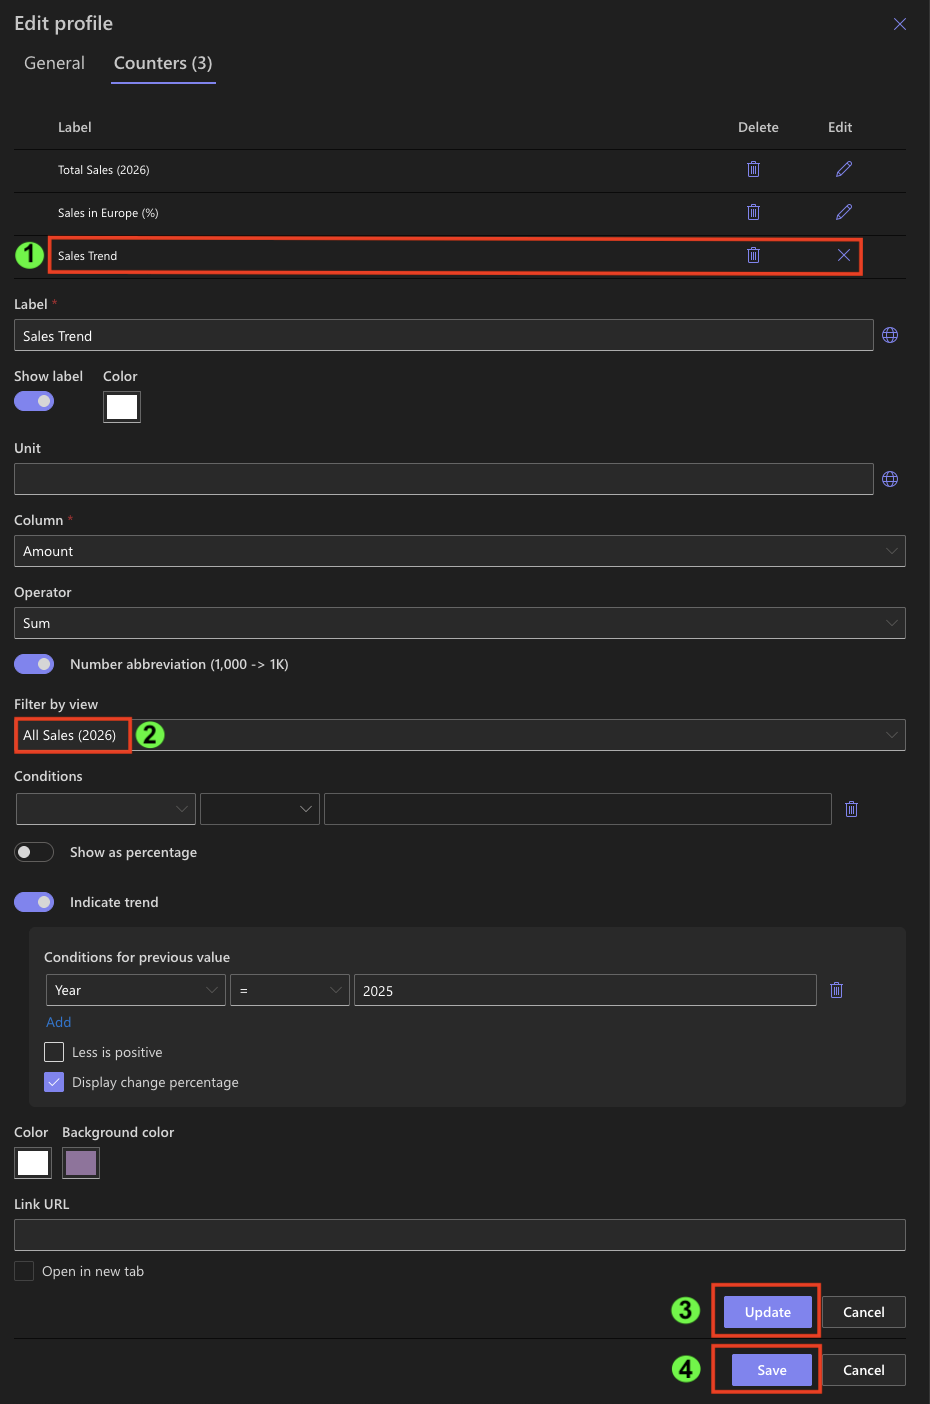
- Sales Trend uses the All Sales (2026) view
This makes counters easier to trust, because users can verify the number by opening the same view.
Pro tip: You can also use date functions in counter conditions instead of fixed values.
For example, $Year([Today]) can be used instead of a specific year, allowing counters to stay up to date automatically without manual changes. This is especially useful when building dashboards that are meant to work across years.
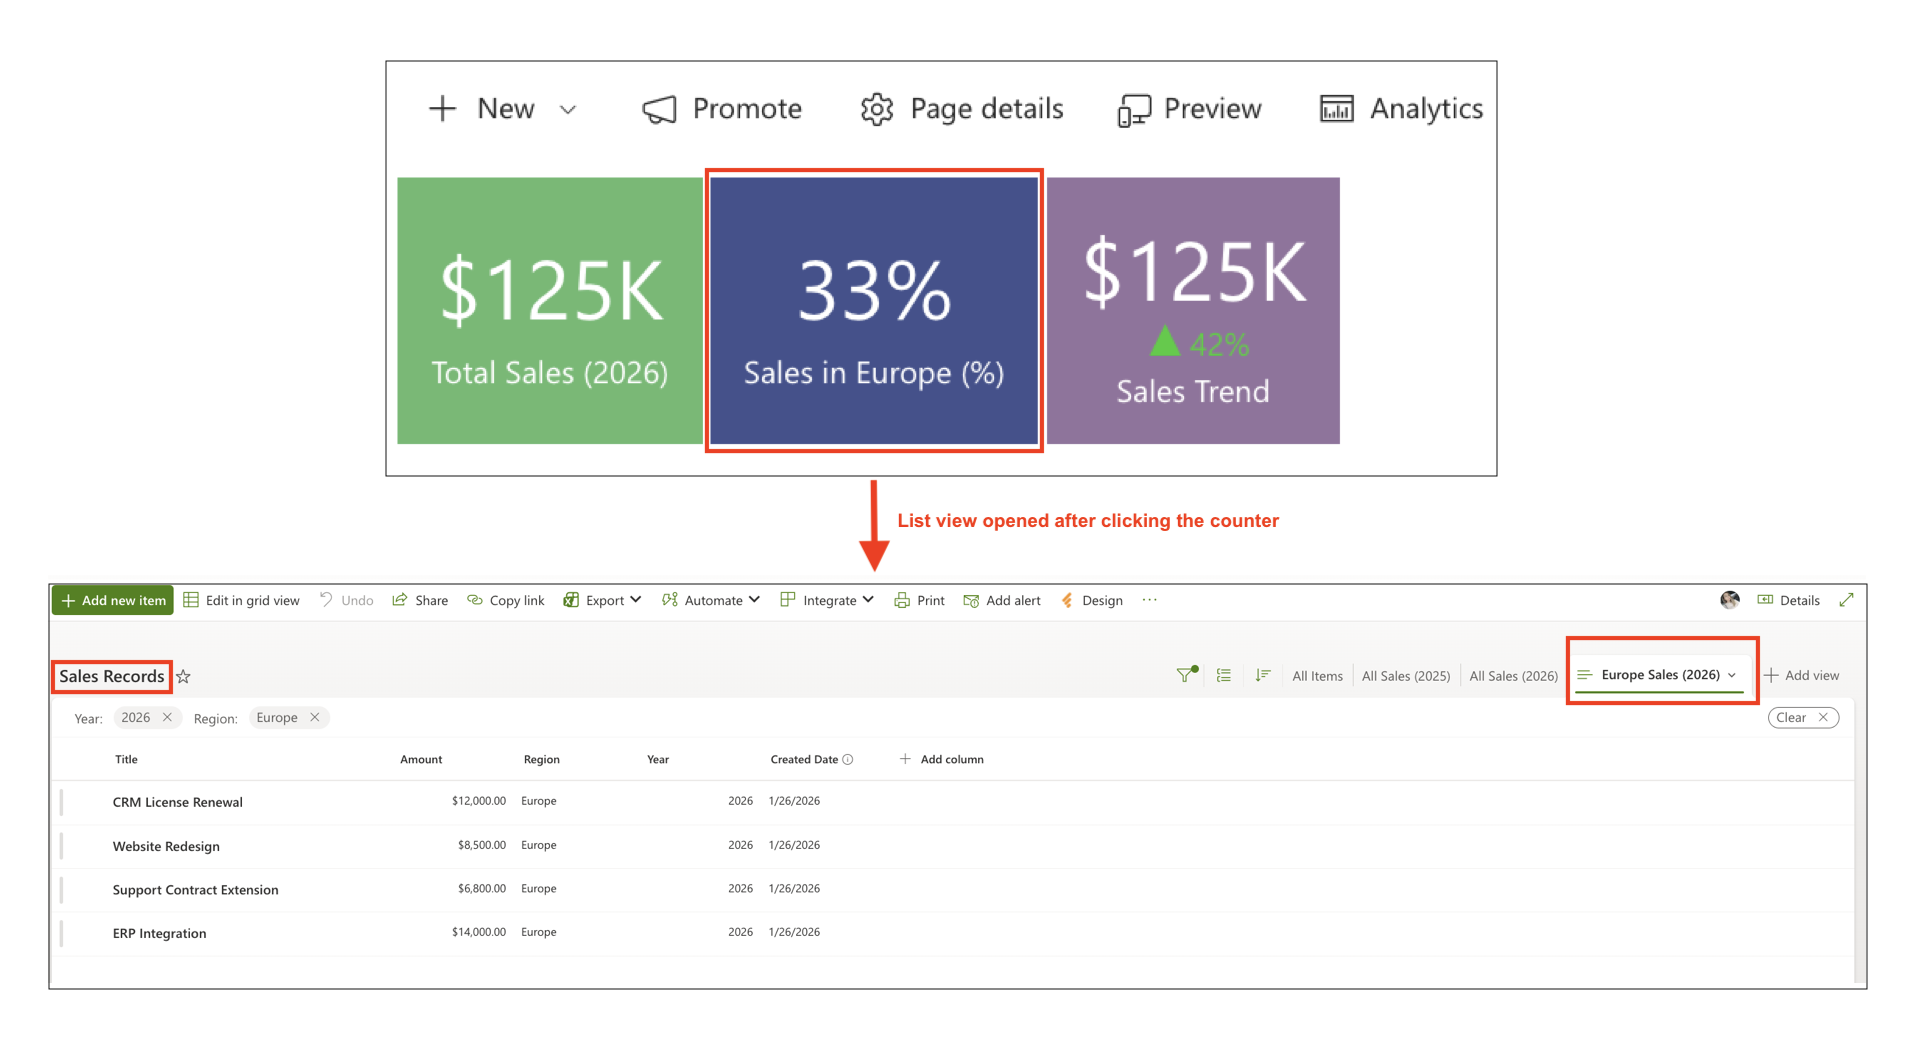
Step 4: Using Links to Drill into the Data
Counters become much more useful when users can click them.
Example: Sales in Europe (%)
- The counter displays the percentage of European sales.
- When a user clicks the value:
- the Europe Sales (2026) view opens
- users can see the exact records behind the number
This approach allows dashboards to stay simple while still giving access to full details.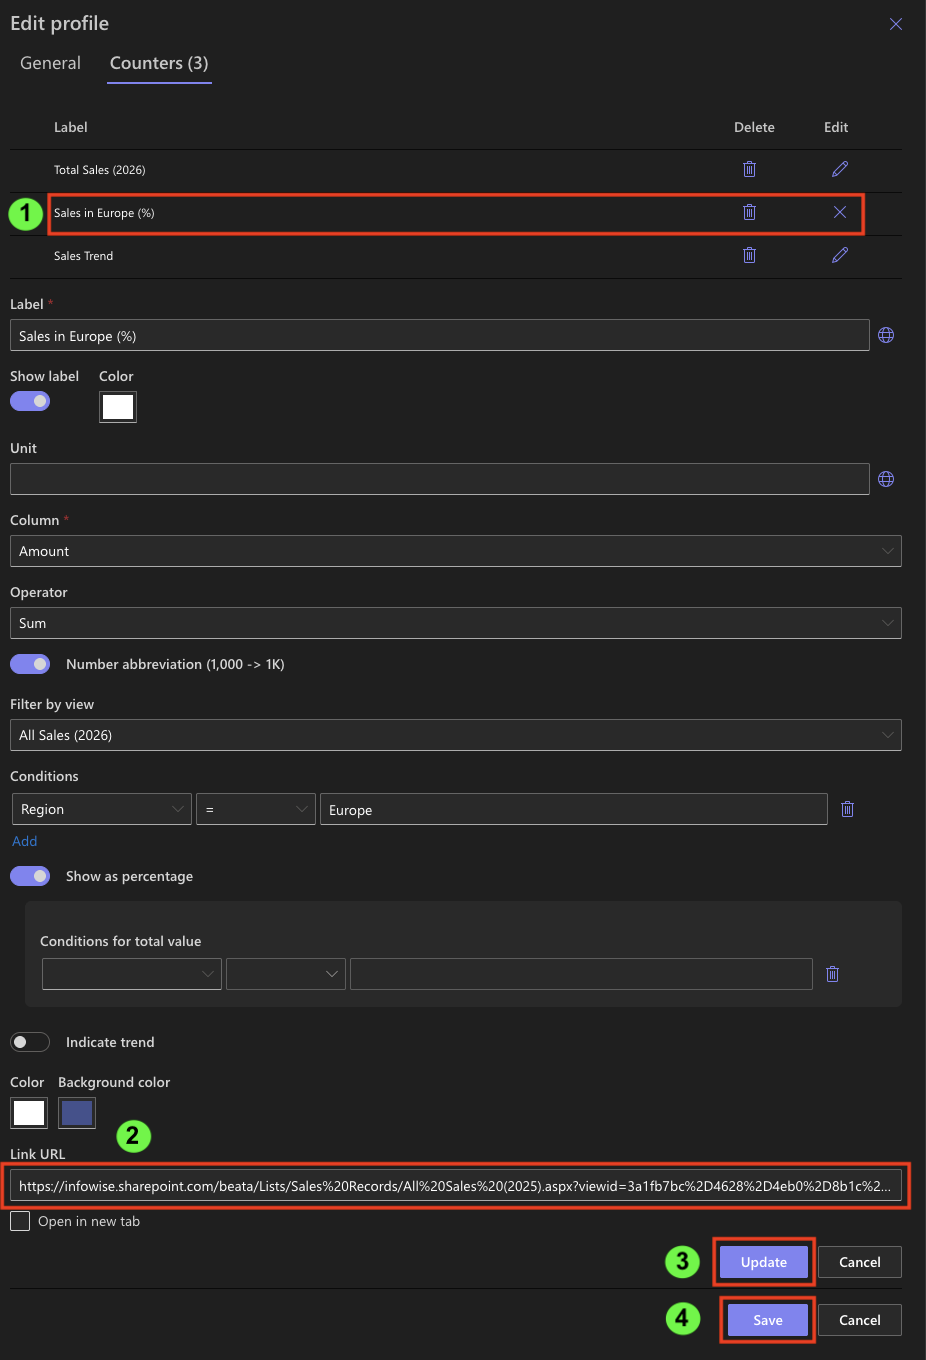
Step 5: Understanding the Trend Counter
The Sales Trend counter compares two views:
- current year sales
- previous year sales
Users do not need to understand the configuration details.
They only need to know:
- ▲ means sales increased
- ▼ means sales decreased
Trend indicators provide direction, not analysis, and help users quickly assess performance.
Step 6: How Users Work with These Counters
From a user’s point of view:
- Open the Sales Performance page
- Review total sales
- Check the regional percentage
- Look at the trend indicator
- Click a counter if something needs attention
Counters guide users toward the right questions without overwhelming them.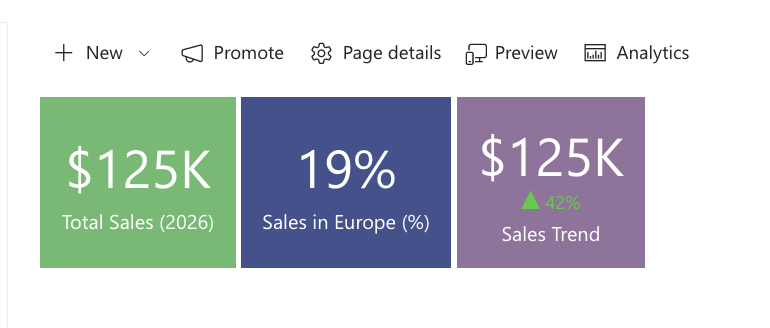
Summary
In this tutorial, you learned how existing Counters can be enhanced using views, counter conditions, and links.
The key takeaway is that views define what data is included, while counters define how that data is calculated.
Understanding this distinction is essential for building accurate and trustworthy dashboards.