Displaying Percentage Values and Trends in Counters
This tutorial explains how to display percentage values and trend indicators in Ultimate Forms: Counter.
You will build a realistic sales scenario, configure counters based on numeric or currency data, and display percentage and trend indicators on a SharePoint page.
Before You Start
Percentage and trend indicators rely on numeric values that can be aggregated and compared over time.
For this tutorial, we will use a Sales Performance scenario, which is well suited for demonstrating:
- percentage calculations based on total values
- partial vs total comparisons
- trend indicators showing increases or decreases over time
This scenario allows you to clearly see how percentage and trend indicators enhance Counters without introducing additional calculation logic.
Instructions
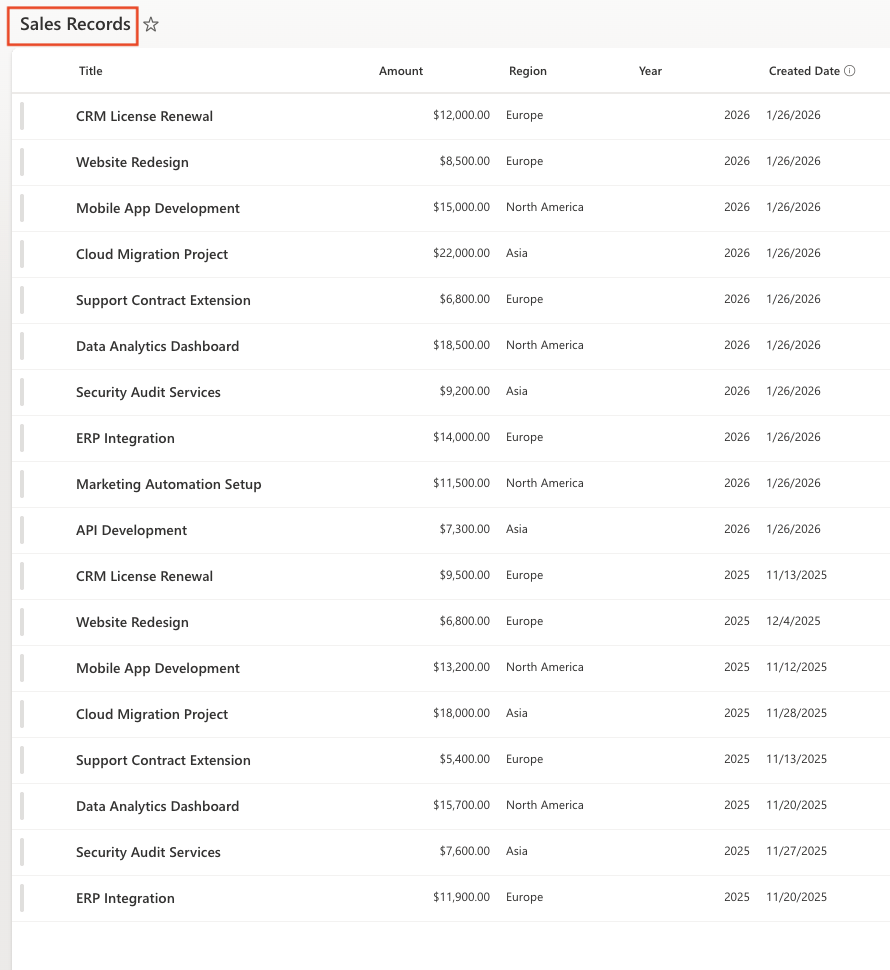
Step 1: Create the Sample List
- Create a List
- Create a SharePoint list named: Sales Records
- Create the Following Columns:
| Column name | Type | Notes |
| Title | Single line of text | Deal or order name |
| Amount | Currency | Used for Sum, Percentage, Trend |
| Region | Choice | Europe, North America, Asia |
| Year | Number | Used for trend comparison |
| Created Date | Date | Optional, for time-based filtering |
- Add Sample Items
- Add at least 10–15 items across:
- multiple regions
- at least two different years (for example: 2025 and 2026)
- Add at least 10–15 items across:
This data set allows you to demonstrate:
- total sales
- regional sales percentages
- increase or decrease over time.
Example Counters Used in This Tutorial
In this tutorial, we will build a small sales dashboard using the following counters:
- Total Sales (Current Year)
Sum of all sales amounts for the current year - Sales in Europe (%)
Percentage of European sales compared to total sales - Total Sales Trend
Shows whether total sales increased or decreased compared to the previous year
These counters demonstrate:
- Sum
- Percentage
- Trend indicators
Step 2: Open Counters in Ultimate Forms
- Open the Sales Records list.
- Click Design to open Ultimate Forms.
- Select Counters.
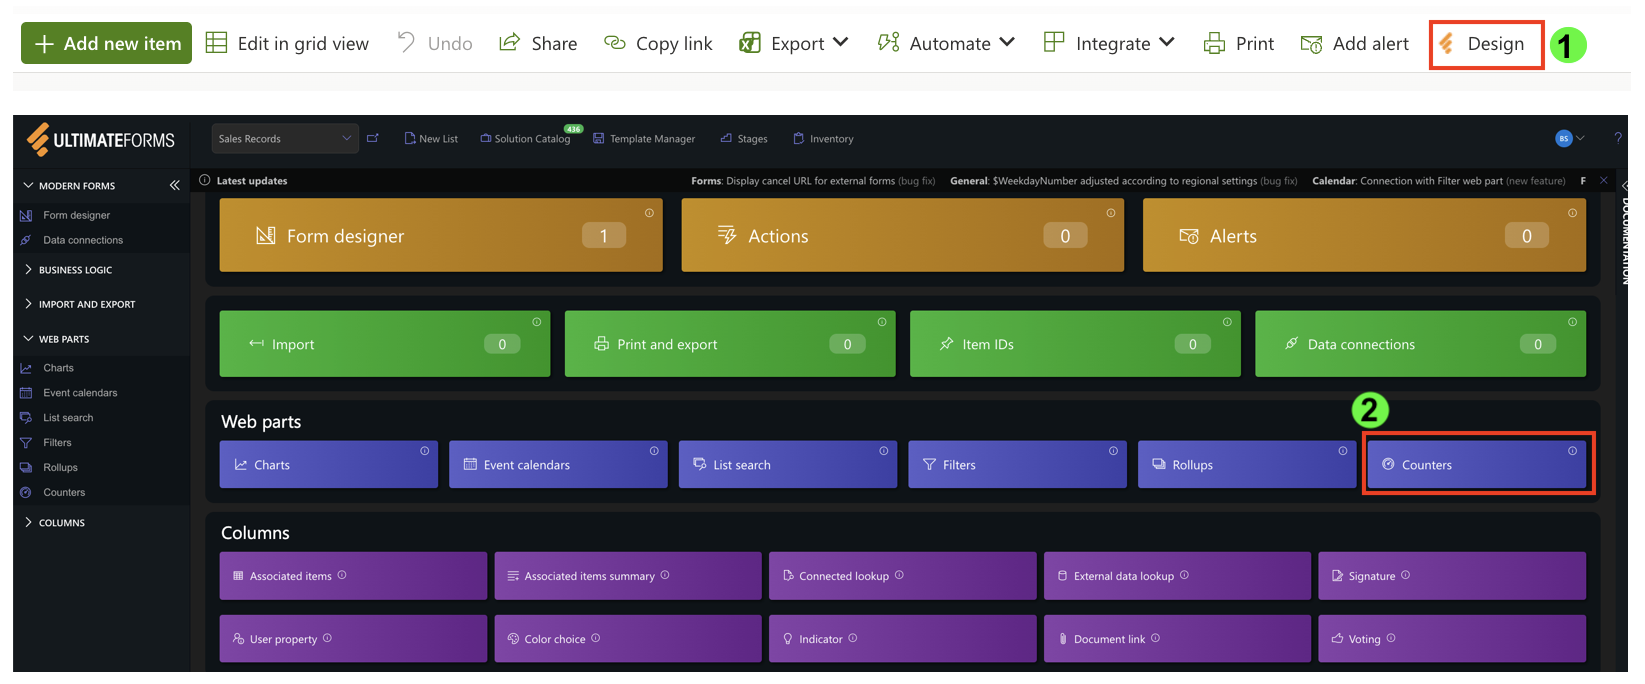
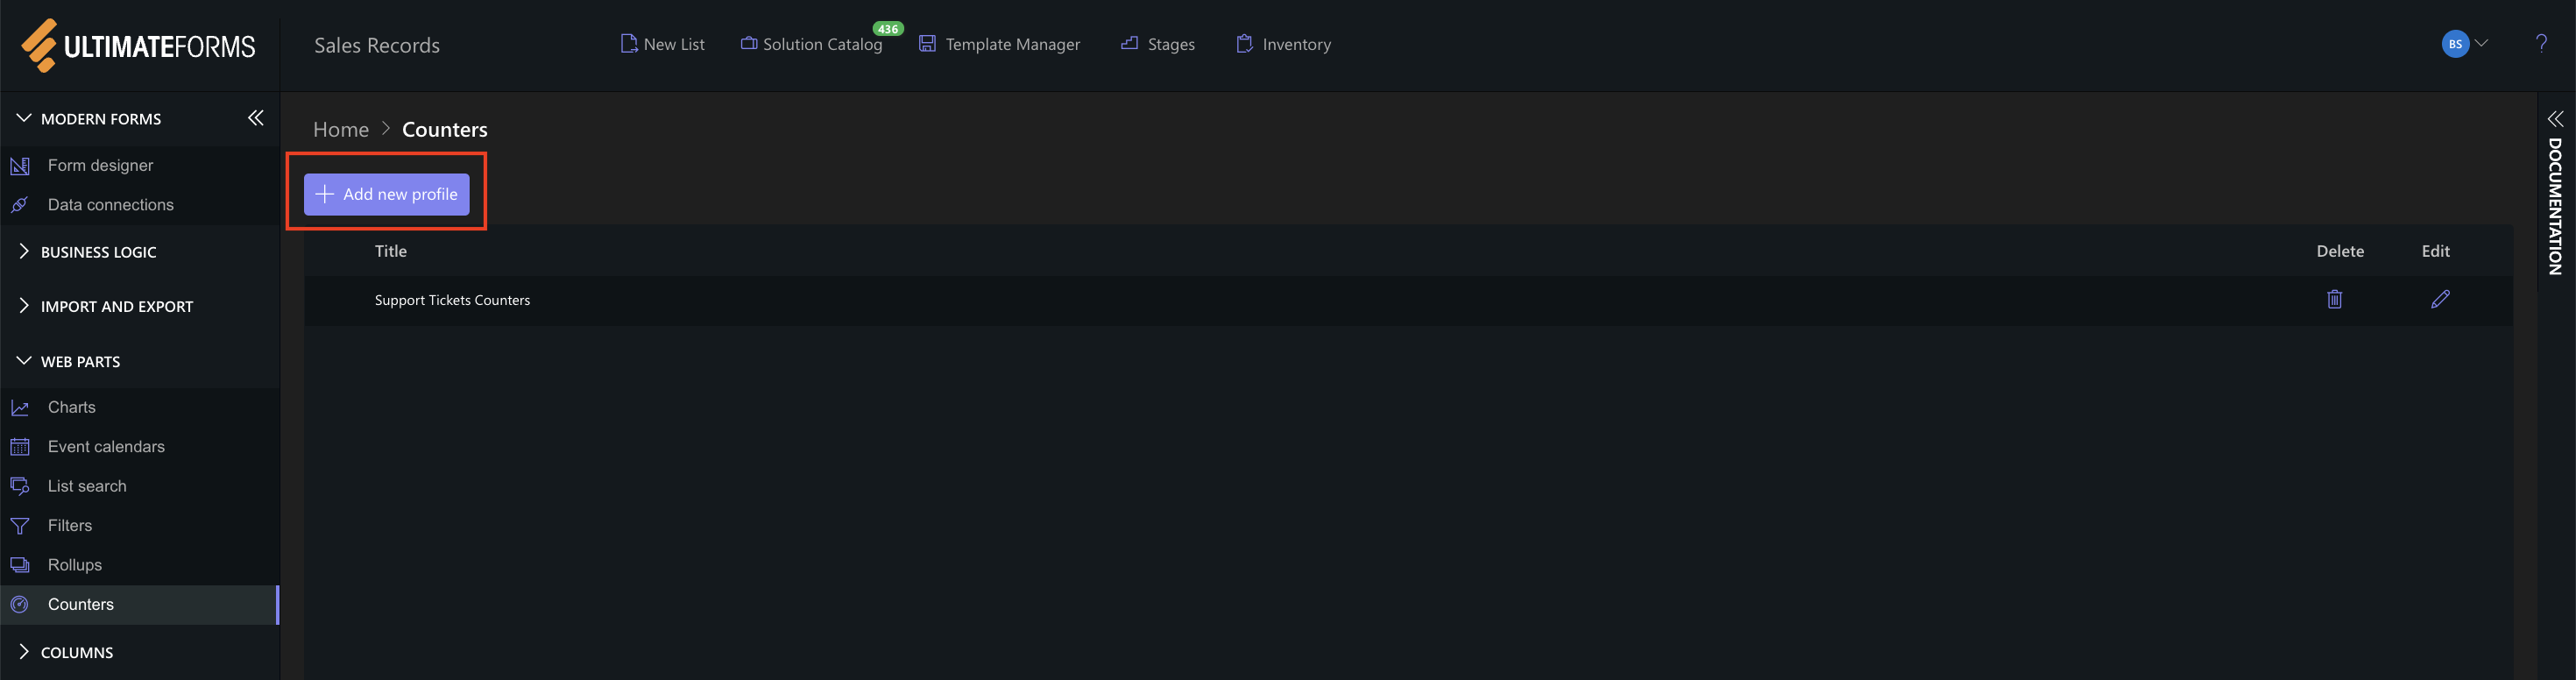
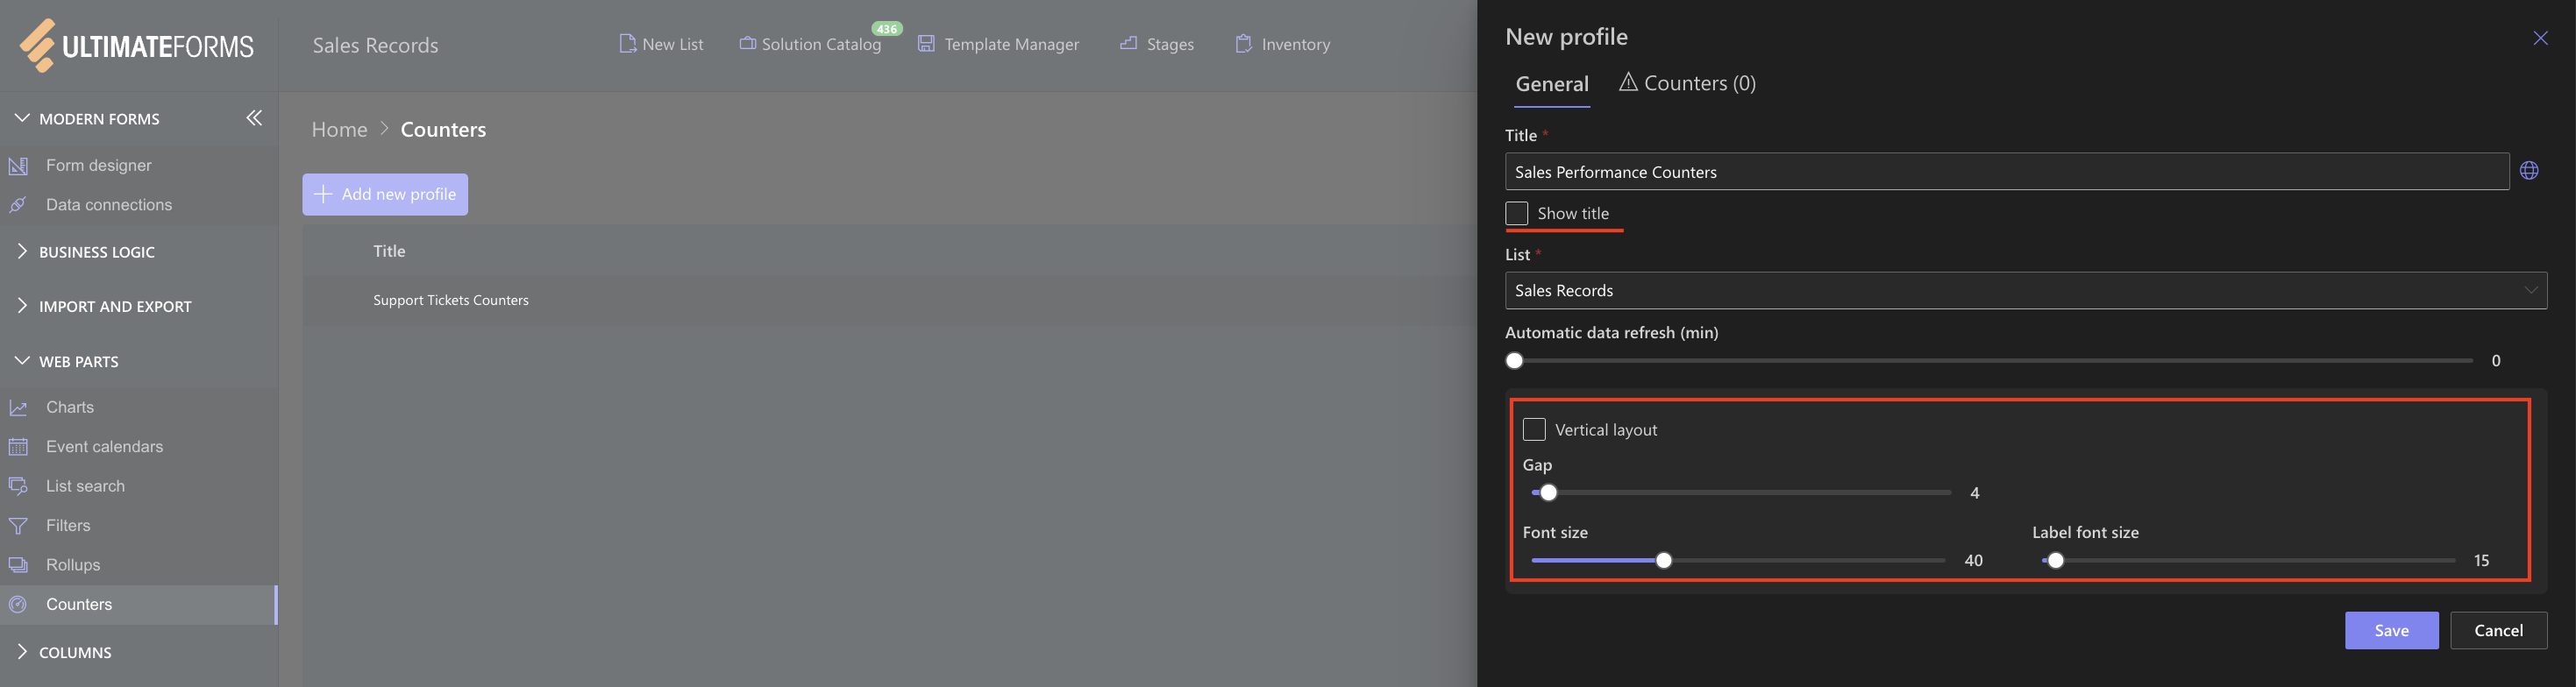
You will see the Counters profiles page with the option to create a new profile.
Step 3: Create a New Counters Profile
- Click Add new profile.
- In the General tab, configure:
- Profile Title: Sales Performance Counters
- List: Sales Records
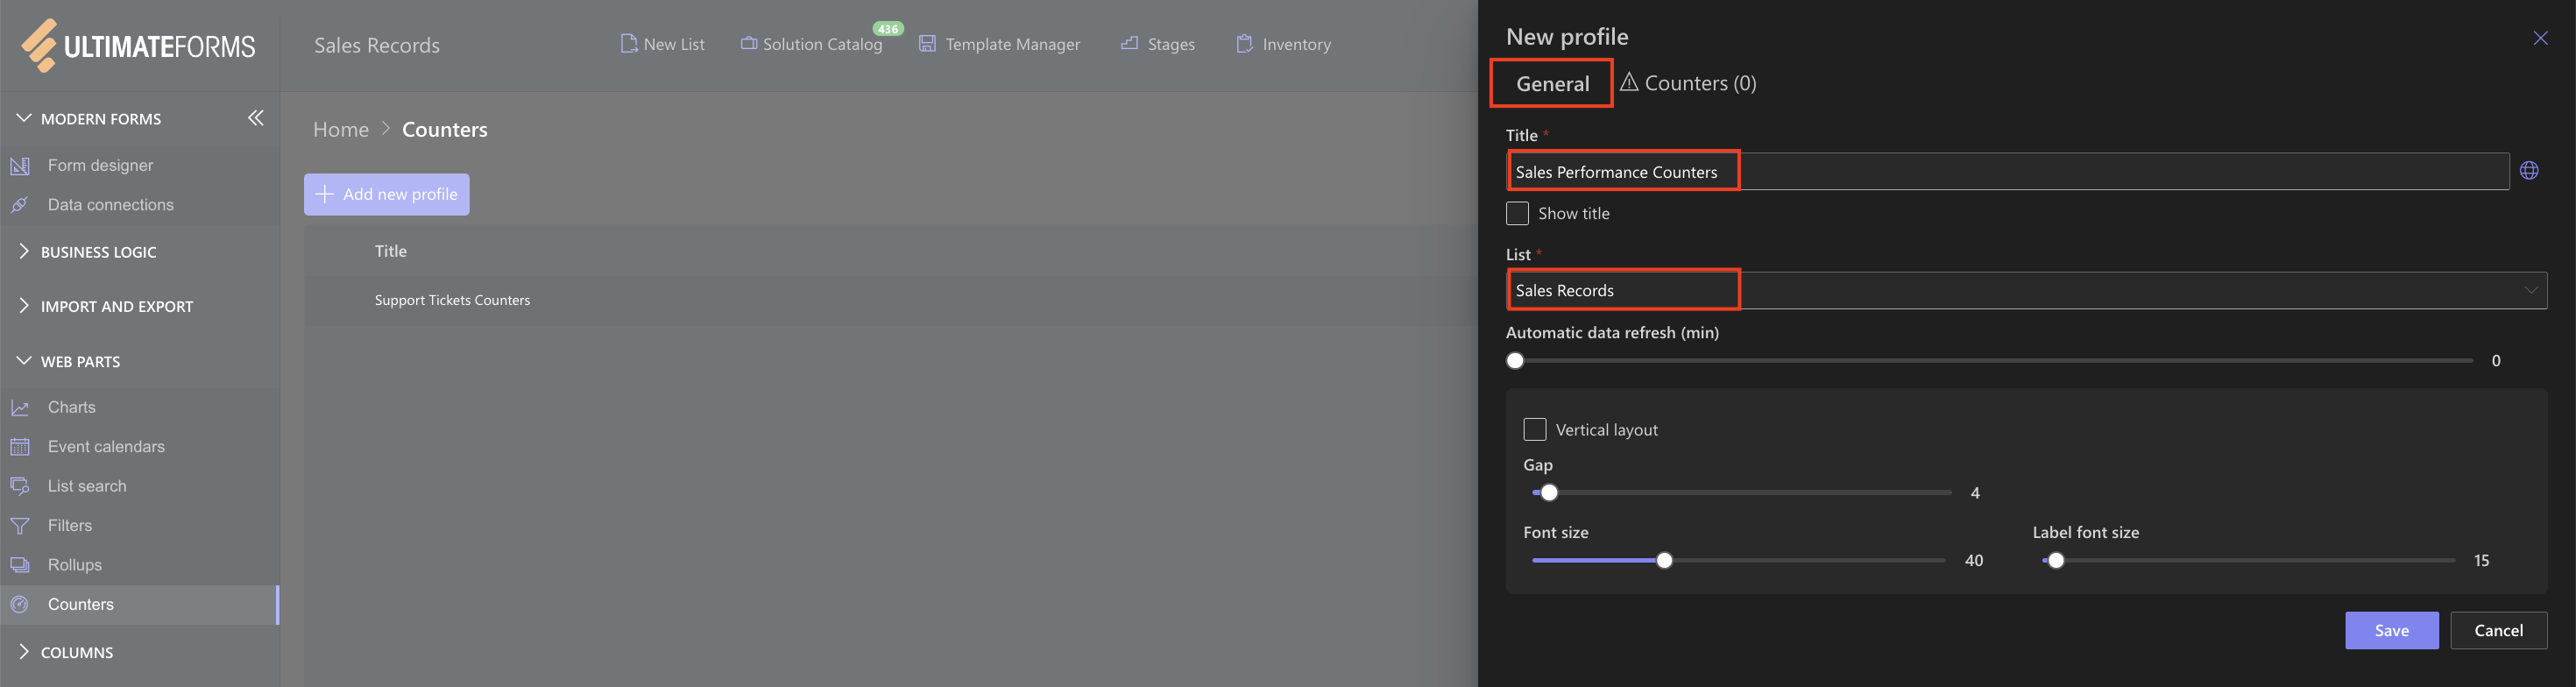
Step 4: Configure General Layout Options
In the General tab, you can control how counters are displayed:
- Show title – optional
- Vertical layout – optional
- Gap – spacing between counters
- Font size / Label font size – adjust for visibility
Step 5: Add Individual Counters
Counter 1: Total Sales (Current Year)
This counter shows the total sales amount for the current year.
- Open the Counters tab.
- Configure:
- Label: Total Sales (2026)
- Column: Amount
- Operator: Sum
- Add a condition:
- Year = 2026
- Click Add.
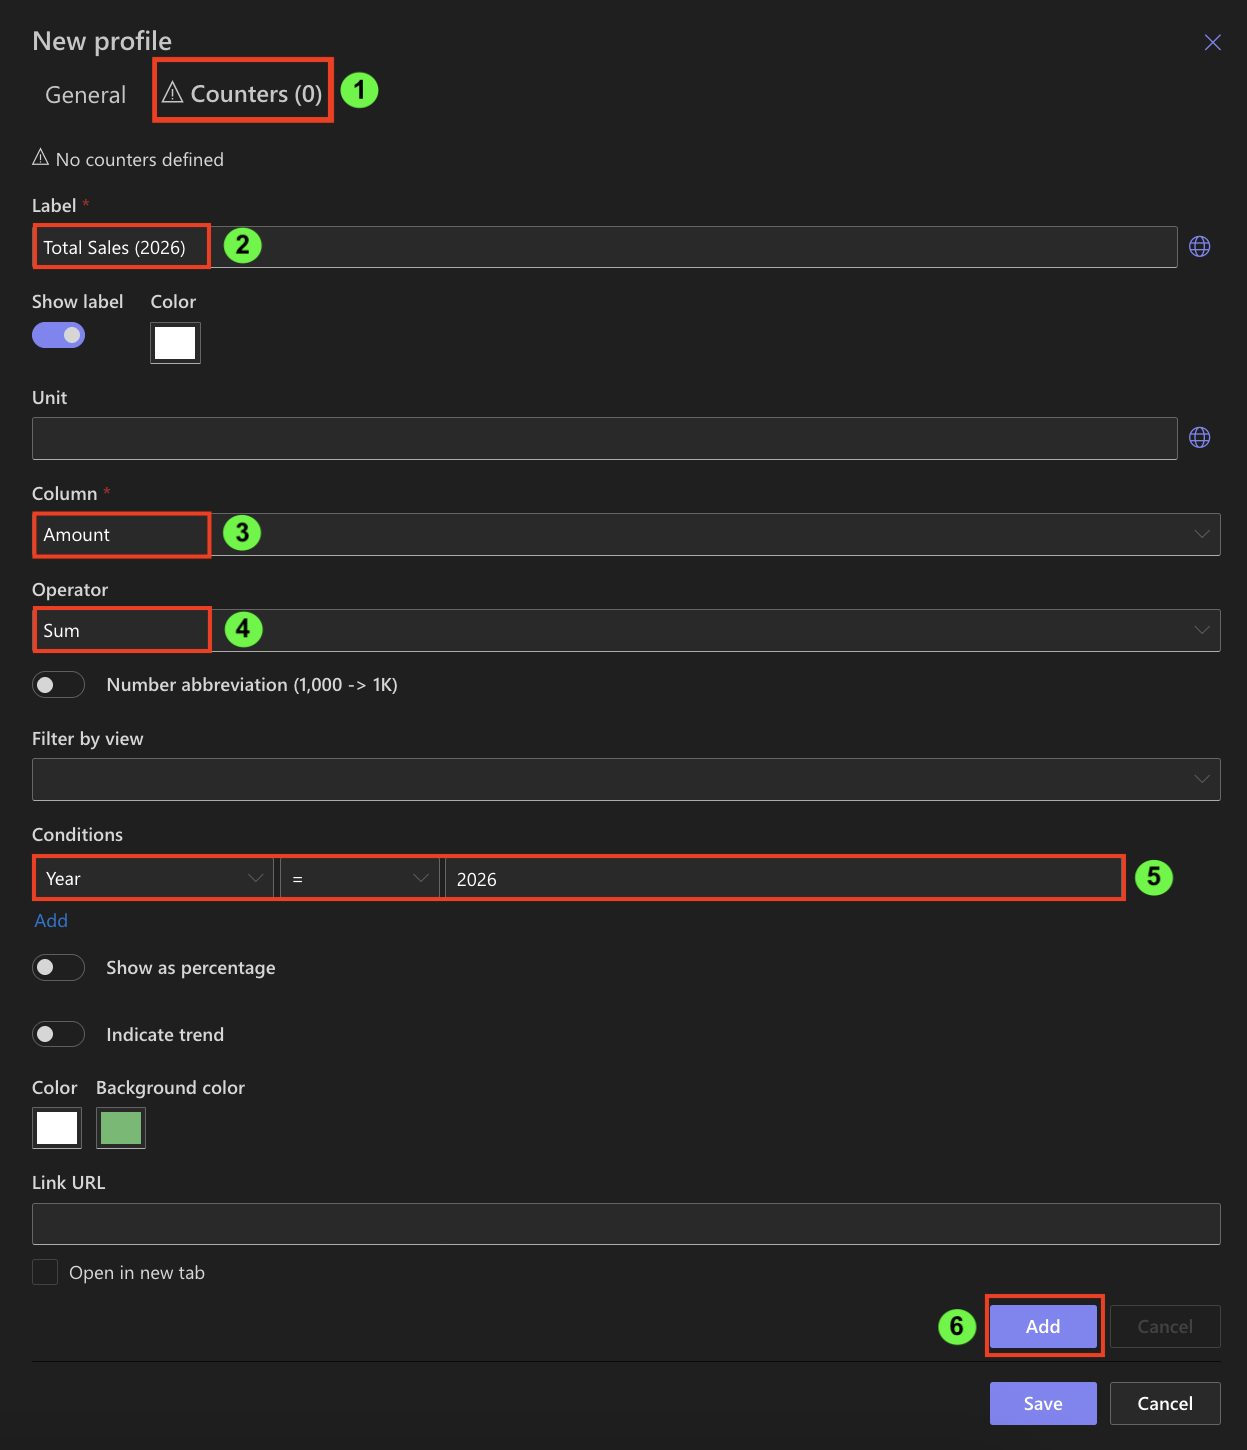
This counter answers the question: What is our total sales value this year?
Pro tip: You can also use date functions in counter conditions instead of fixed values. For example, $Year([Today]) can be used instead of a specific year, allowing counters to stay up to date automatically without manual changes.
Counter 2: Sales in Europe (%)
This counter shows the percentage of sales coming from Europe compared to total sales.
- Configure:
- Label: Sales in Europe (%)
- Column: Amount
- Operator: Sum
- Add a condition:
- Region = Europe
- Year = 2026
- Enable Show as percentage.
- Click Add.
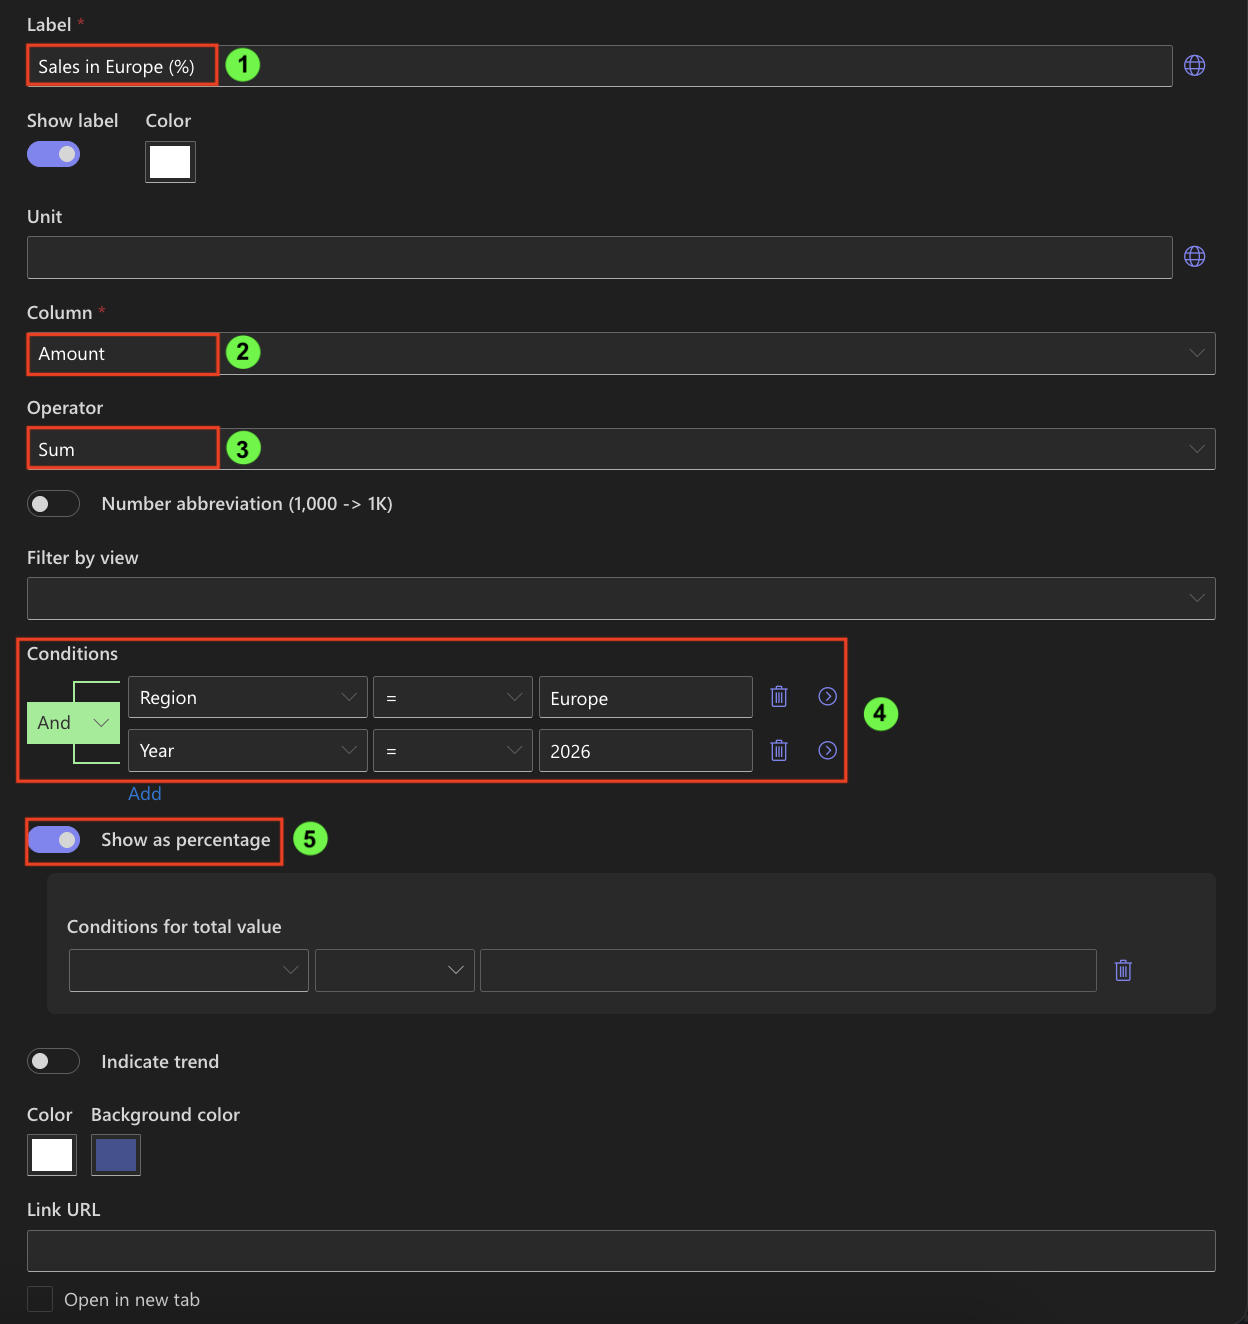
This counter answers the question: What percentage of our revenue comes from Europe?
Counter 3: Total Sales Trend
This counter shows whether total sales increased or decreased compared to the previous year.
- Configure:
- Label: Sales Trend
- Column: Amount
- Operator: Sum
- Enable Indicate trend.
- Current value conditions: Year = 2026
- Previous value conditions: Year = 2025
- Click Add.
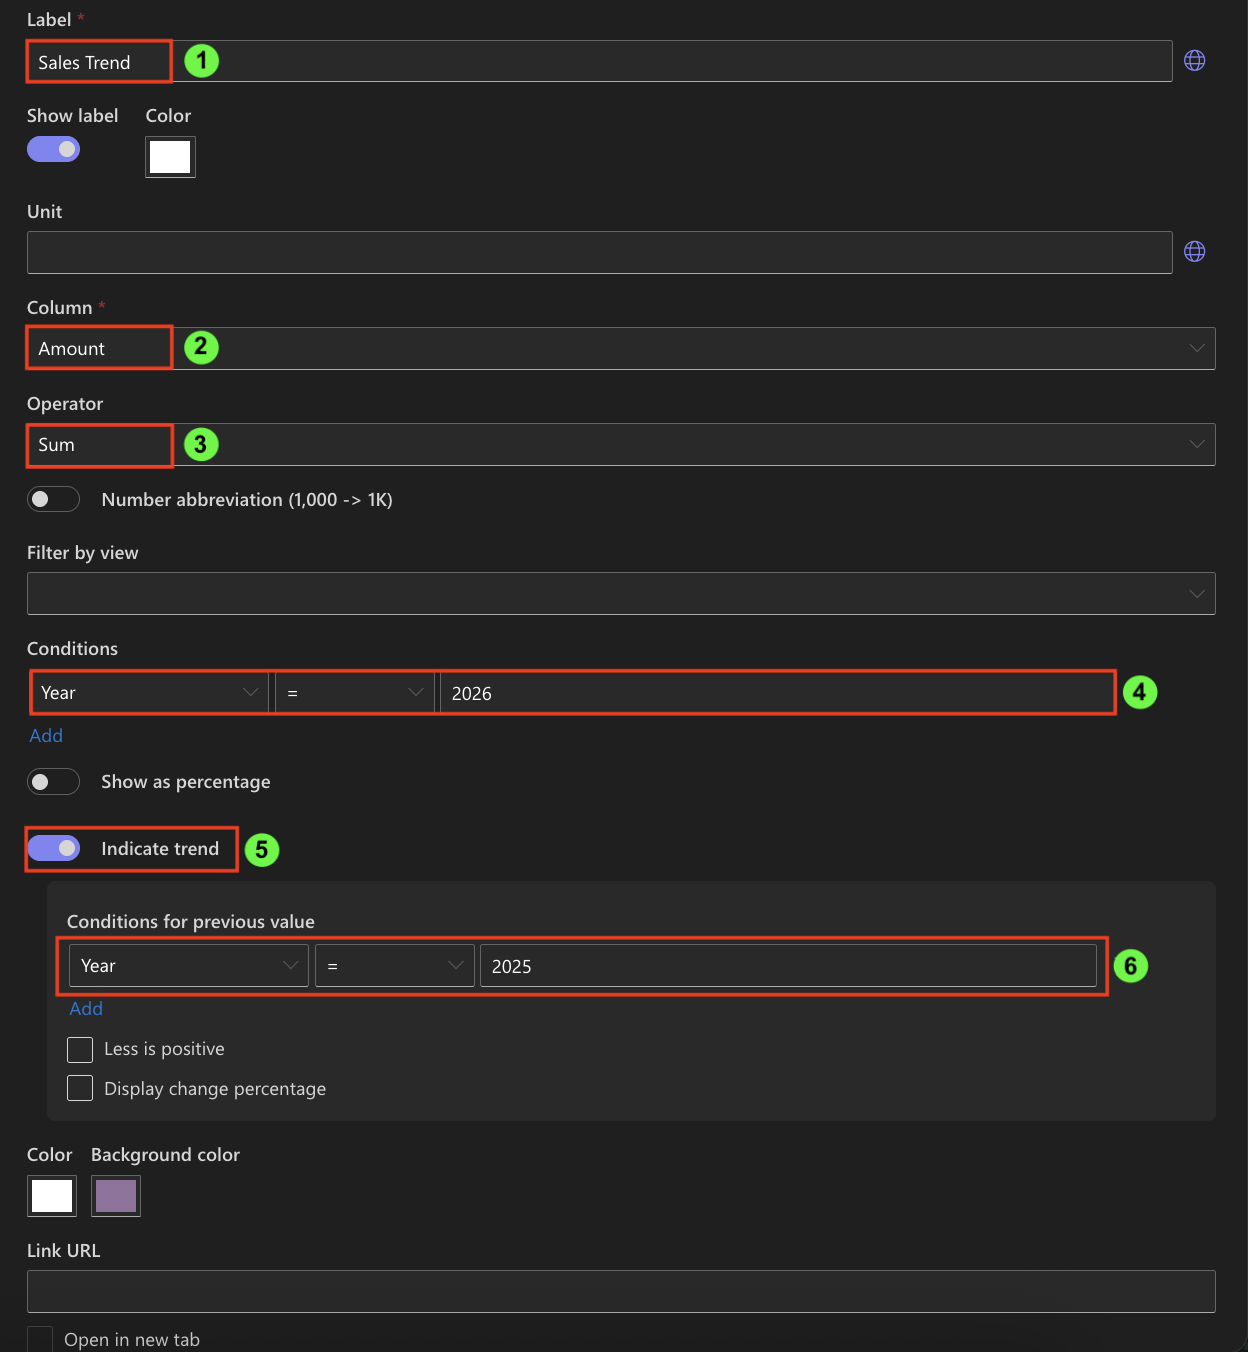
This counter visually indicates growth or decline using trend arrows.
Step 6: Optional Enhancements
You can optionally improve readability:
- Enable number abbreviation (e.g., 1,200 → 1.2K)
- Customize text or background colors
- Add a Link URL to open a filtered list view (for example, Europe-only sales)
These options improve usability but do not affect calculations.
Step 7: Save the Counters Profile
- Review all configured counters.
- Click Save.
Your profile Sales Performance Counters is now ready to use.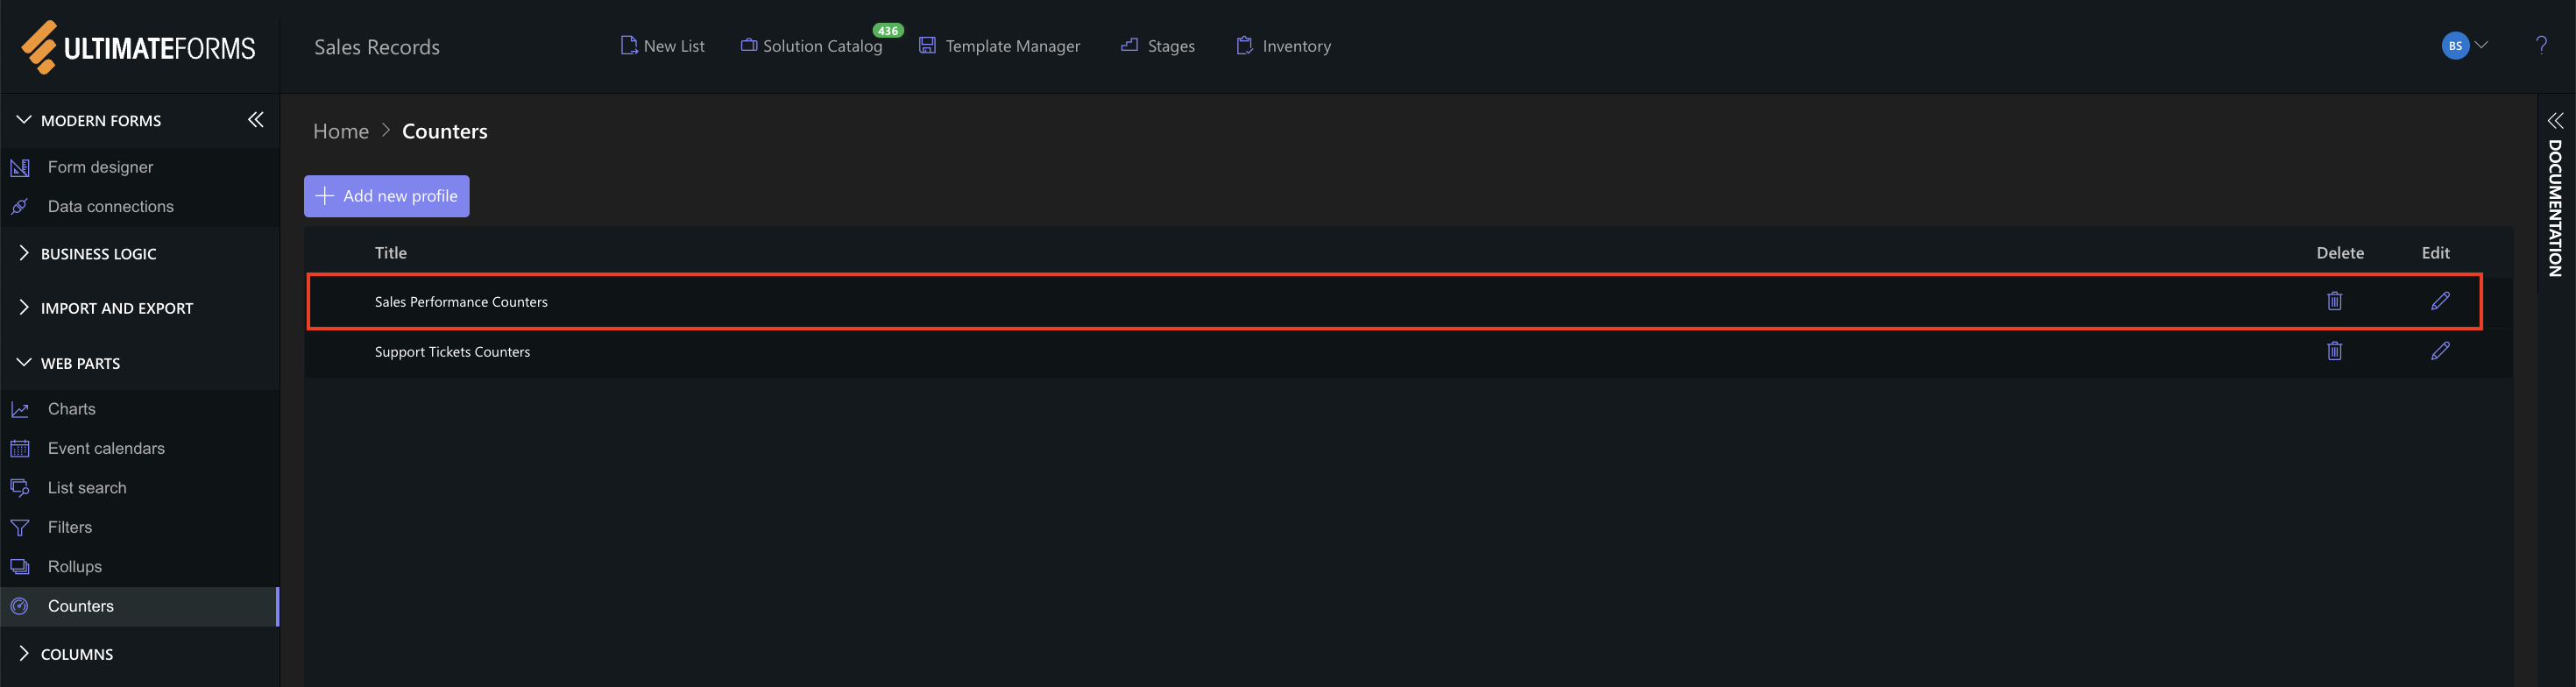
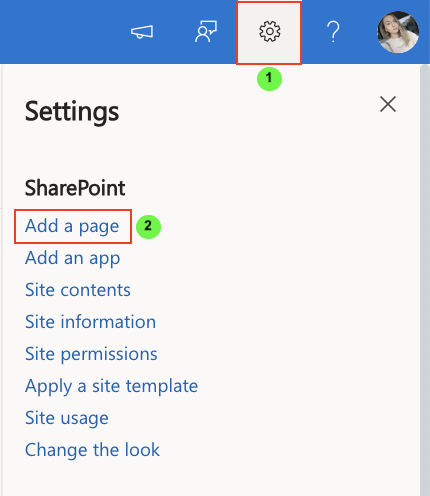
Step 8: Add Counters to a SharePoint Page
- Create or open a SharePoint page.
- Click + and add the Infowise Form web part.
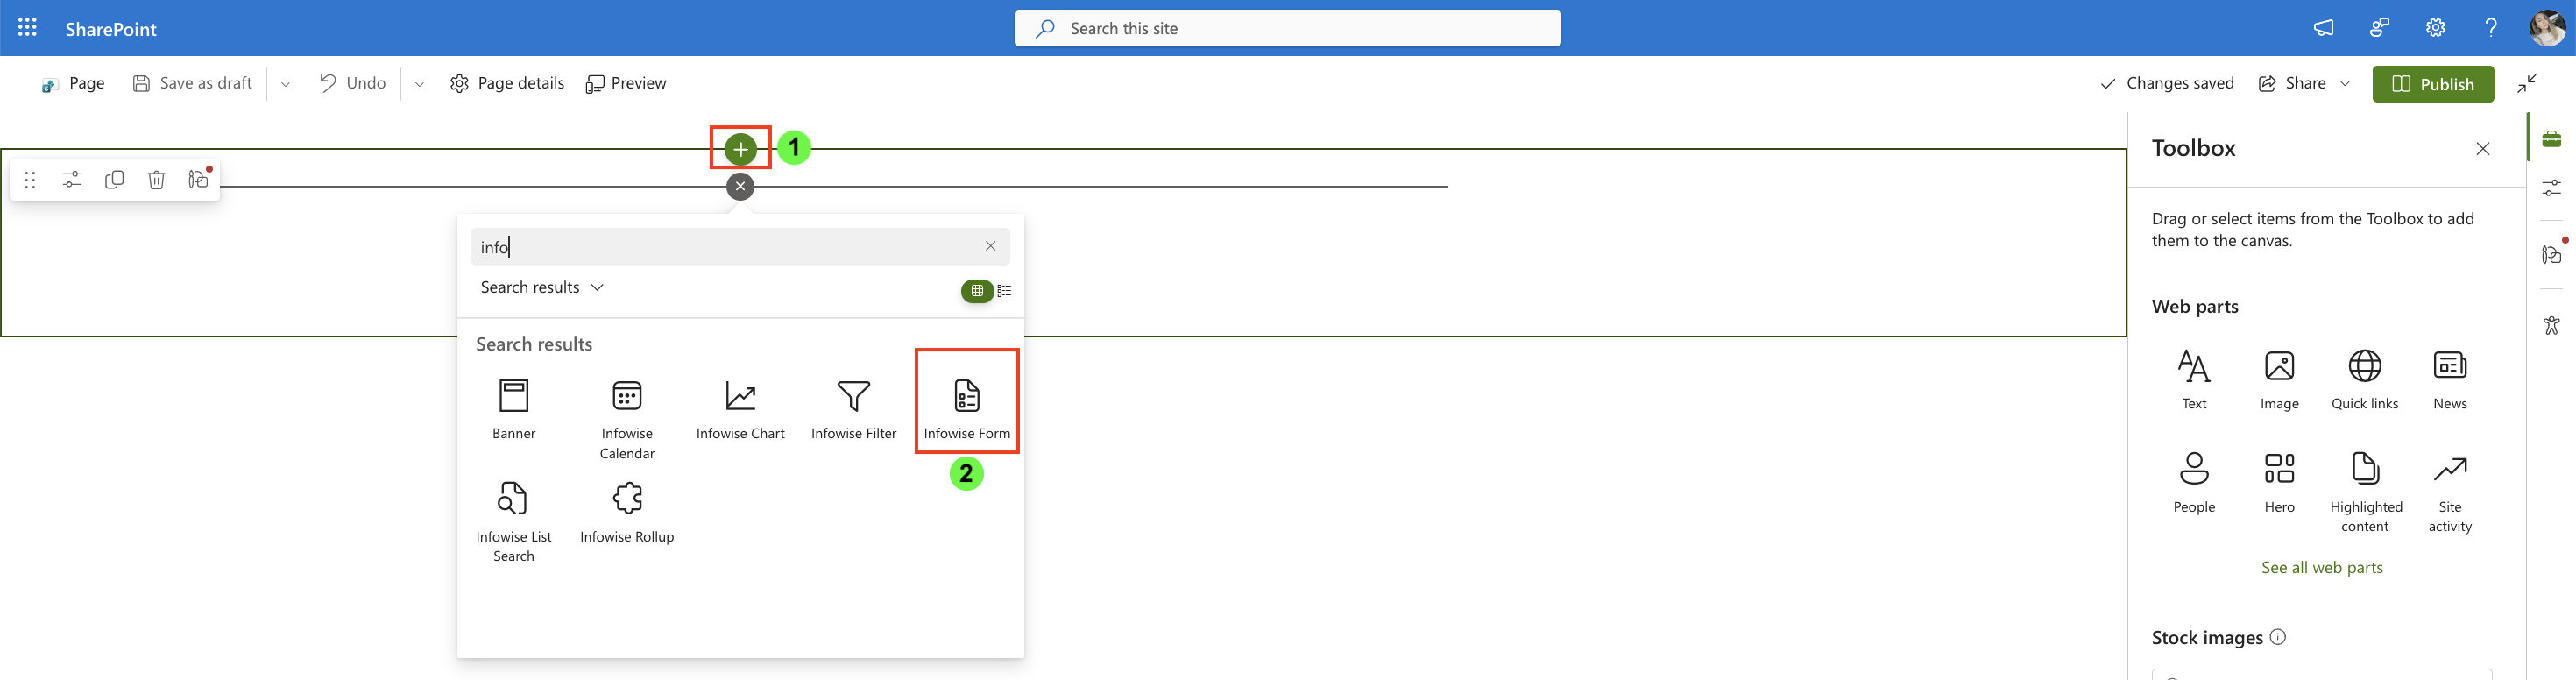
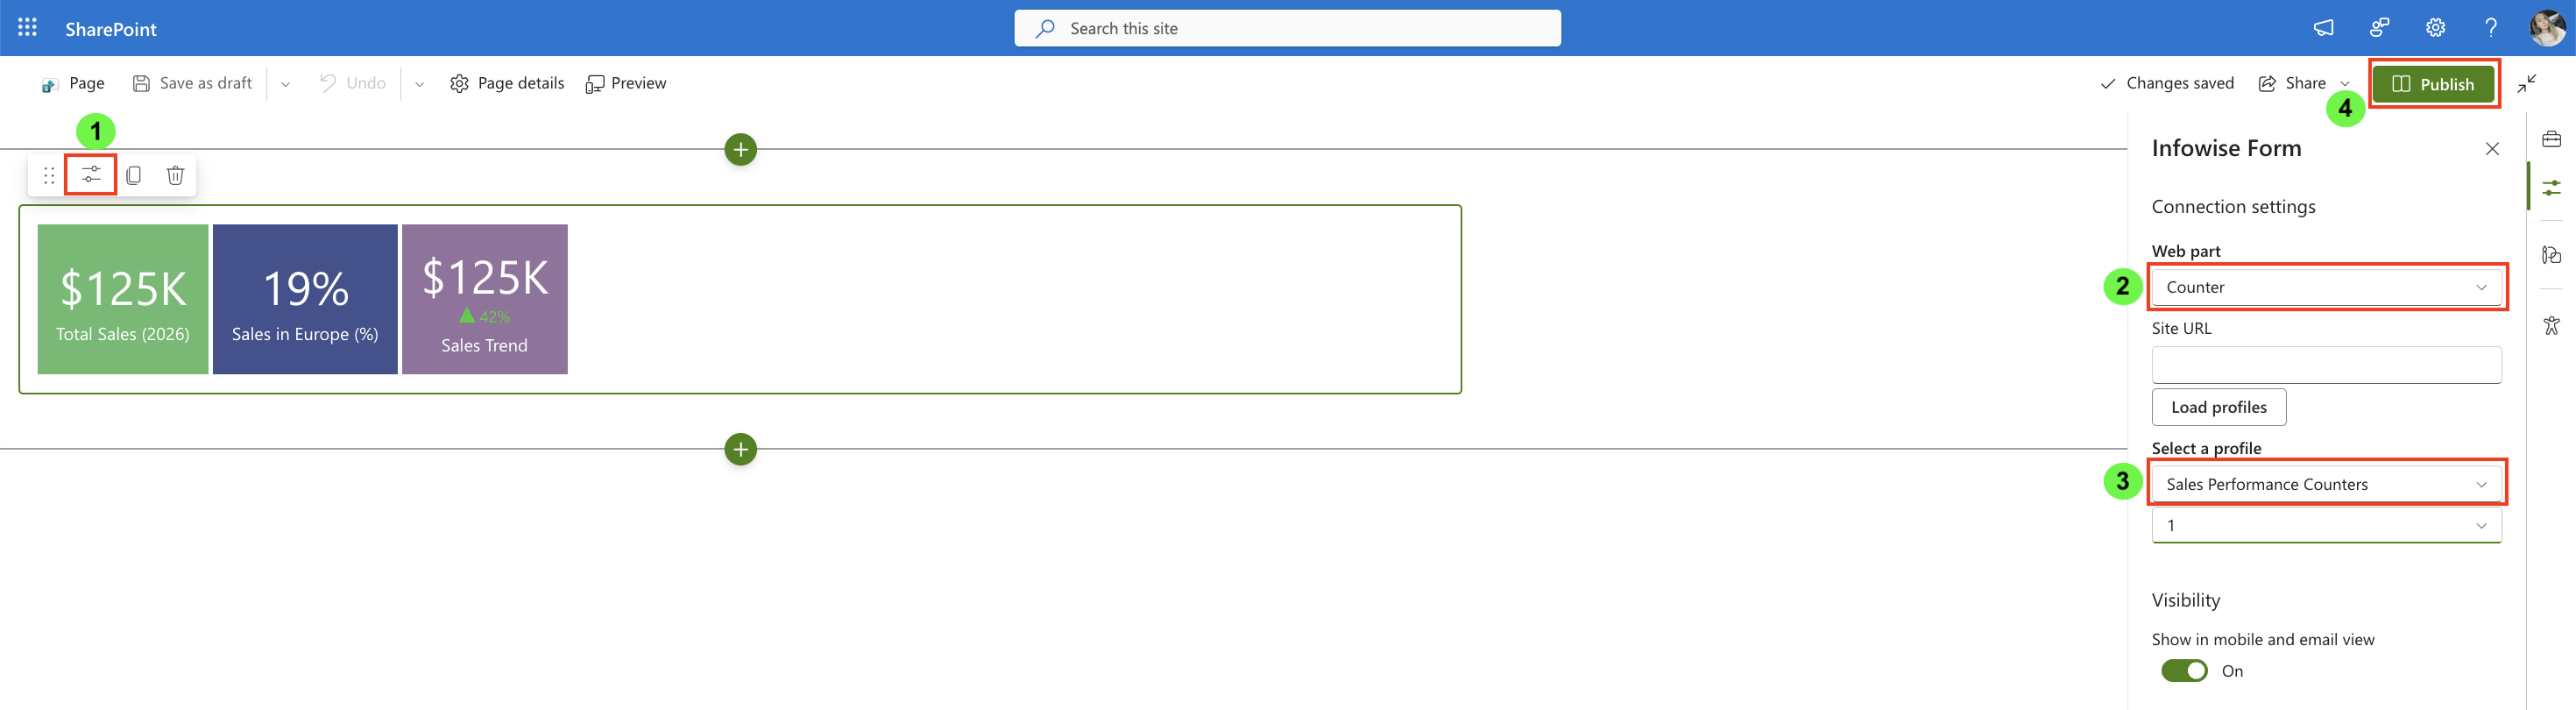
- Open Web part properties.
- Configure:
- Type: Counter
- Profile: Sales Performance Counters
- Publish the page.
Step 9: Review Counters on the Page
After publishing, the counters are rendered immediately using live data.
On the page, you can now see:
- Total Sales (2026) — total revenue for the current year
- Sales in Europe (%) — percentage contribution of Europe
- Sales Trend — visual indicator of growth or decline
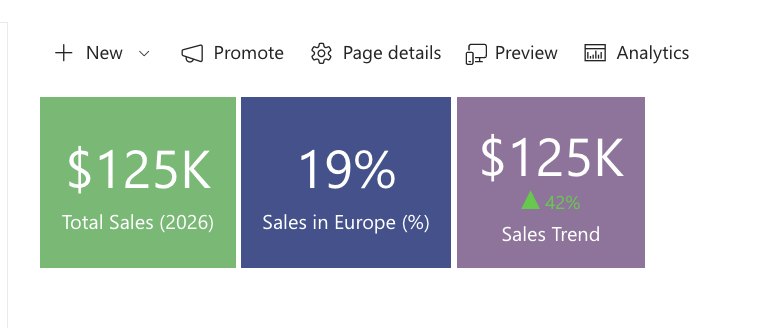
Each counter updates automatically when list items change.
Summary
In this tutorial, you built a realistic sales dashboard using Ultimate Forms: Counter and explored advanced display options such as percentages and trend indicators.
You learned how to:
- use numeric and currency columns for advanced counters
- calculate percentages
- compare current and previous values with trend indicators
- display live business metrics on a SharePoint page
This tutorial intentionally uses a simple but realistic sales data model to focus on how percentage and trend display options enhance standard counters.
In the following tutorials, you can build on this foundation and apply these techniques to more complex scenarios and dashboards.