Documentation
Adding and Configuring Web Part
Placing Web Part on Page
The web part can be placed on any web part page in the same way as any web part.
- Open page in Edit mode.
- Click on Add Web Part at the top of the relevant web part zone.
- Under Infowise section locate Infowise Smart Chart Pro web part.
- Add it to page.
Configuring Web Part
You must configure the source list for the web part to be able to show data.
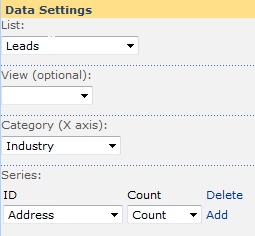
Configuring List
- Edit the web part’s properties
- Select a list from the available lists
- Optionally select a view. Any filtering present in the selected view are applied to the chart data
- Select the Category column, this is usually the column displayed on X axis
- Enter one or more data series by selecting a column and an operation. Note that not all chart types support multiple series. In some cases adding a second series will result in an error. You can specify how the data is grouped according to the Category column values. You can select Count, Sum or Average. Note that although all options are available for all column types, unless the column is numeric, only Count operation will be used.
Creating Web Part Connection
- Put the web part or the page into editing mode. One way to achieve this is to click on Edit Page in the Site Actions menu.
- In the drop-down menu at the top right corner of the web part select Connections.
- Under Connections, select Send Smart Chart Pro To and then select the web part you wish to filter from the list.
- In some cases you will see a pop-up message asking you to choose the connection type. In this case choose Filter.
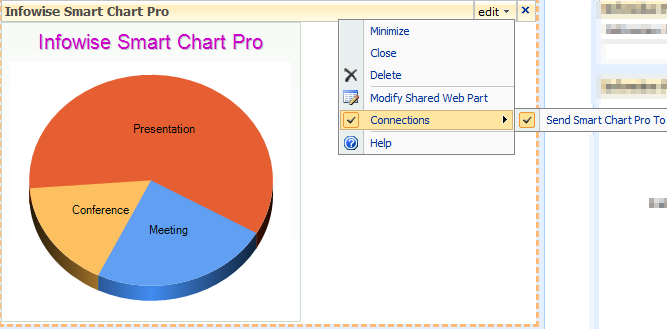
Now when you click on different part of the chart, the connected web parts are filtered accordingly
Configuring Look and Feel
You can configure multiple options to make the chart look exactly as you need it.
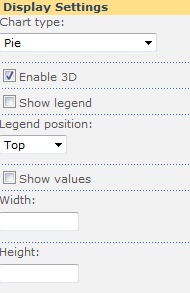
- Chart type – select one of the possible chart types
- Enable 3D – display the chart in 3D
- Show legend – show chart legend
- Legend position – position of legend relative to chart
- Show values – show numeric values within the chart
- Width – width of chart area in pixels
- Height – height of chart area in pixels
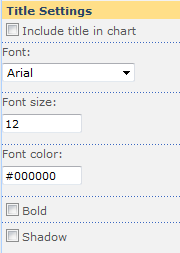
- Include title in chart – show title as part of chart
- Font – title font
- Font size – title font size
- Font color – title font color
- Bold – show title in bold font
- Shadow – show drop shadow for title
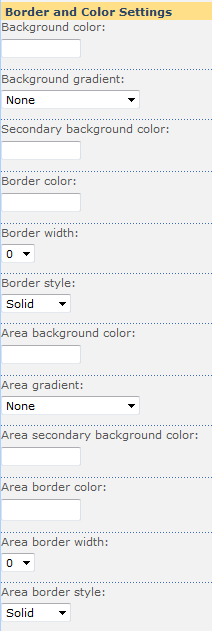
- Background color – background of the chart
- Background gradient – gradient between background color and secondary background color
- Secondary background color – second color used by gradient
- Border color – color of border around the chart
- Border width – width of border around the chart
- Border style – style of border around the chart
- Area background color – color of background of the chart area
- Area gradient – gradient between area background color and area secondary background color
- Area border color – color of border around the chart area
- Area border width – width of border around the chart area
- Area border style – style of border around the chart area
Last modified: 4/21/2014 3:40 PM
Loading...
Add your comment
Comments are not designed to replace support calls. If you have a specific issue with one of our products, please send an email to support@infowisesolutions.com to open a support ticket.