Documentation
Indicator Field
Using the Indicator field you can display your numbers and/or dates in a eye-catching, user-friendly format using KPIs, progress bars and countdowns. For example, display your actual sales vs preset goals as a colorful icon, allowing the managers to know the current status at a glance.
KPI
KPI stands for Key Performance Indicator and allows you to assign colorful icons to each of the 3 ranges (low, medium and high). As you are the one assigning the ranges and the icons, low does not necessarily means “bad”.
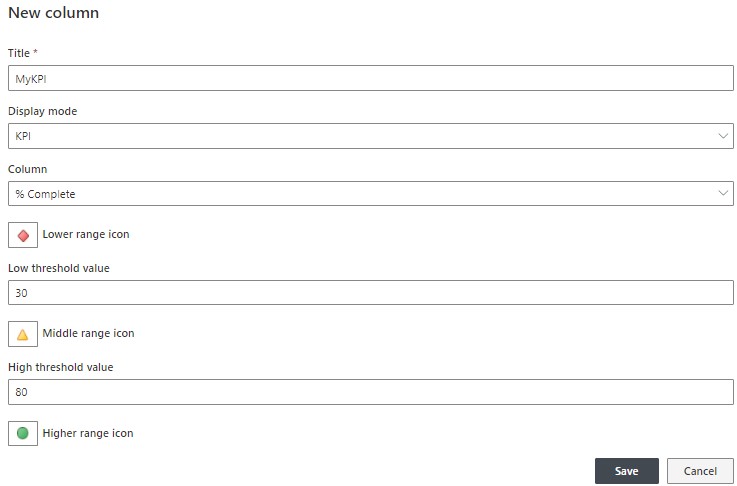
- Choose a list containing the data you want to add a KPI to. The data should be stored in a Number or Date column.
- Create new Infowise Indicator column.
- Select the data column to assign KPI to
- Assign icons to all three ranges
- Enter threshold values. The entered values can contain column values (by entering column name surrounded by square brackets), functions and simple arithmetics. Use the value picker (using the icon on the right) to help you build the value. For example, [Sales]*.8 would be 80% of sales and [Today]+10 would be 10 days from today. You can also enter simple scalar values, such as 100.
Progress Bar
The progress bar mode allows you to display a difference between two values (e.g., actual vs budget).
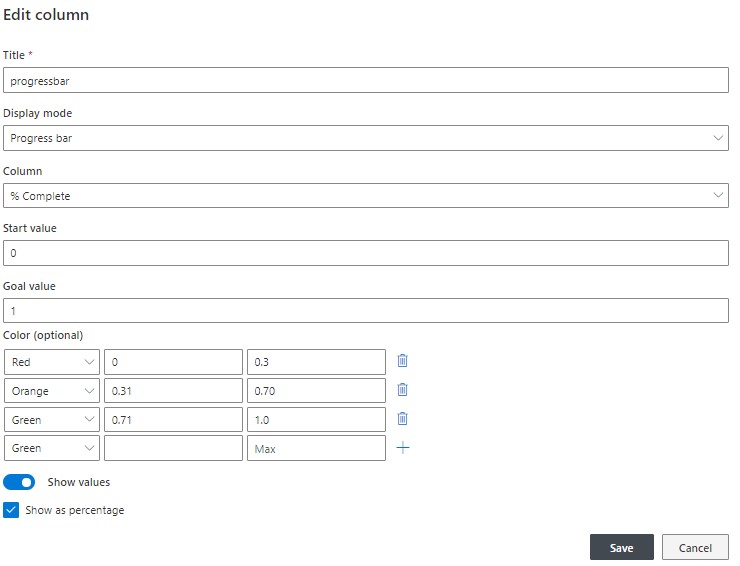
- Choose a list containing data you want to display as progress bar. The data should be stored in a Number or Date column.
- Create new Infowise Indicator column.
- Select the data column to show progress for
- Enter goal value. The entered value can contain column values (by entering column name surrounded by square brackets), functions and simple arithmetics. Use the value picker (using the icon on the right) to help you build the value. For example, [Sales]*.8 would be 80% of sales and [Today]+10 would be 10 days from today. You can also enter simple scalar values, such as 100.
Countdown
You can display a dynamic countdown to and from any date value. You can select what time units to use as well (from years down to seconds).
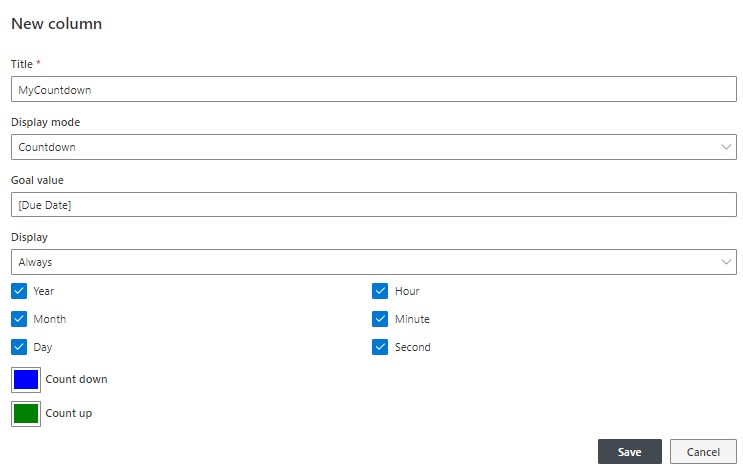
- Create new Indicator column in any list.
- Enter goal value. The entered value can contain column values (by entering column name surrounded by square brackets), functions and simple arithmetics. Use the value picker (using the icon on the right) to help you build the value. For example, [Today]+10 would be 10 days from today.
- Select Display mode of the countdown:
- Always - count until goal value is reached and count after.
- Up - count only after goal value has been reached.
- Down - count until the goal value is reached.
- Select time units you want to be displayed.
- Pick colors for count down and count up values.